Varied parameter
Saving rate
5% → 25%
Lawyer in Madrid · Peak earning years
This page compares financial outcomes for a Lawyer living in Madrid, Spain, following the Peak earning years life scenario.
A high-income trajectory with strong saving capacity and rapid wealth accumulation. Compounding works faster here, but results remain exposed to market cycles and timing.
Madrid concentrates many higher-paying roles and business opportunities, with a correspondingly higher urban cost structure.
The comparison focuses on how changing the Saving rate influences long-term results, while all other assumptions remain constant.
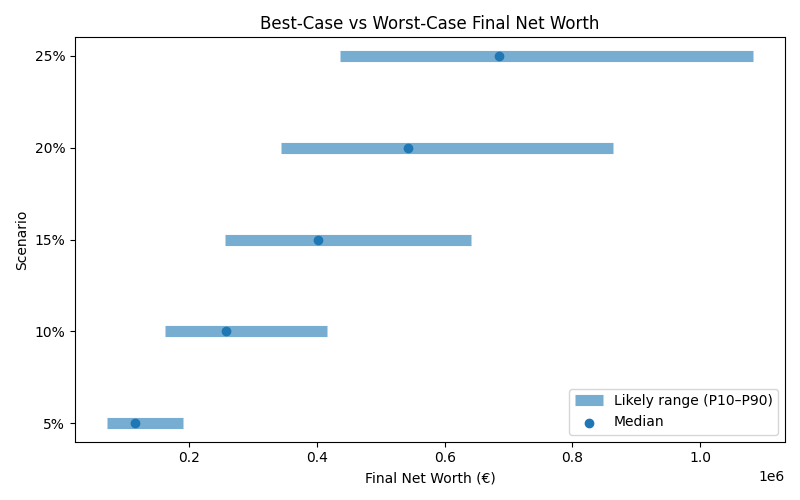
Results are shown as a realistic range. P10 represents a pessimistic outcome, while P90 represents an optimistic outcome. Most simulations fall between these two values.
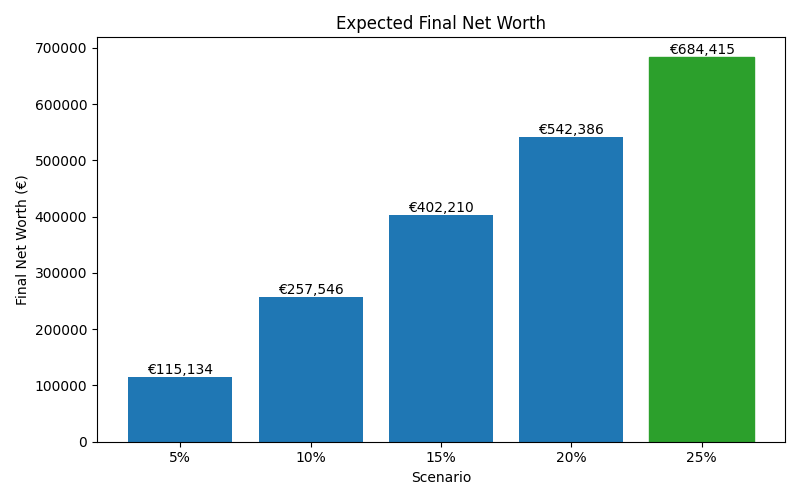
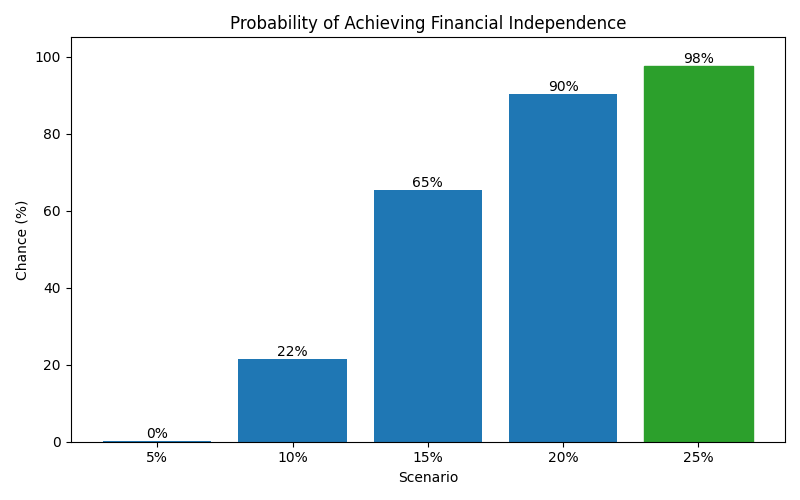
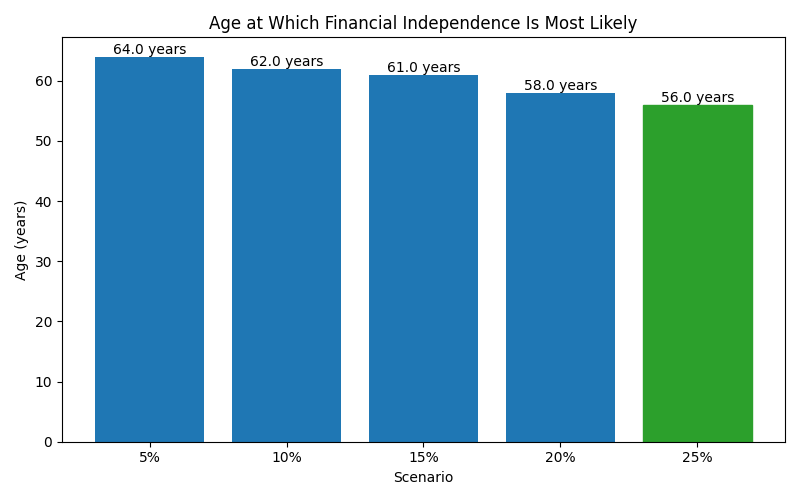
| Scenario | Median Net Worth | P10 Net Worth | P90 Net Worth | FI Probability | FI Median Age |
|---|---|---|---|---|---|
| 5% | 115,134 | 71,381 | 190,275 | 0% | 64 |
| 10% | 257,546 | 162,273 | 416,332 | 22% | 62 |
| 15% | 402,210 | 255,927 | 641,587 | 65% | 61 |
| 20% | 542,386 | 343,748 | 863,267 | 90% | 58 |
| 25% | 684,415 | 435,672 | 1,082,688 | 98% | 56 |
These charts show how each scenario affects long-term outcomes, including expected wealth, downside risk, and the likelihood of achieving financial independence.