Varied parameter
Income tax rate
0% → 30%
Lawyer in Barcelona · Fast-track independence
This page compares financial outcomes for a Lawyer living in Barcelona, Spain, following the Fast-track independence life scenario.
A high-intensity saving and investing strategy aimed at reaching financial independence as early as possible. Strong outcomes require discipline, sacrifice, and tolerance for market risk.
Barcelona combines a broad service and tech market with elevated living costs relative to the Spanish national average.
The comparison focuses on how changing the Income tax rate influences long-term results, while all other assumptions remain constant.
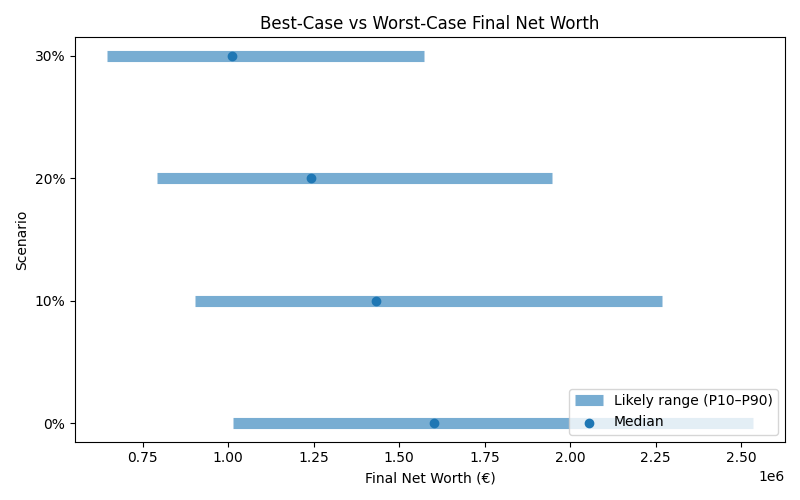
Results are shown as a realistic range. P10 represents a pessimistic outcome, while P90 represents an optimistic outcome. Most simulations fall between these two values.
| Scenario | Median Net Worth | P10 Net Worth | P90 Net Worth | FI Probability | FI Median Age |
|---|---|---|---|---|---|
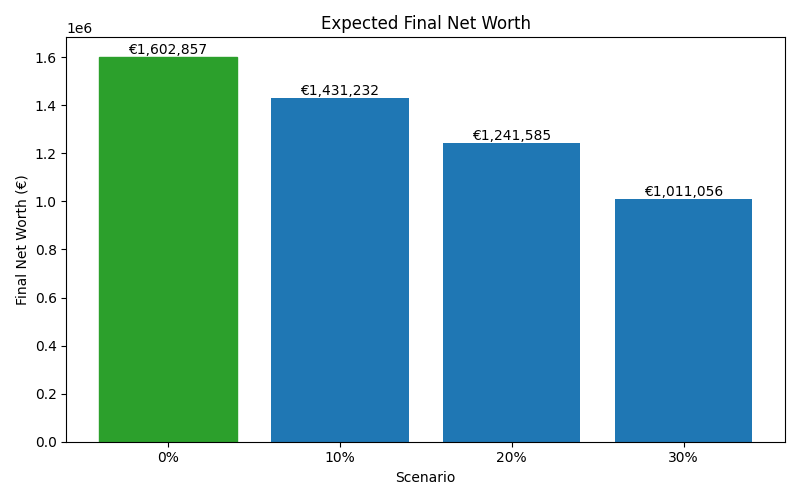
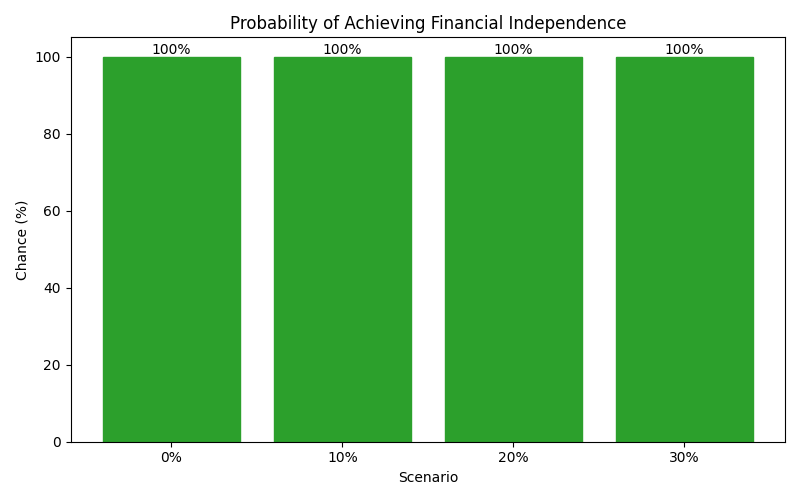
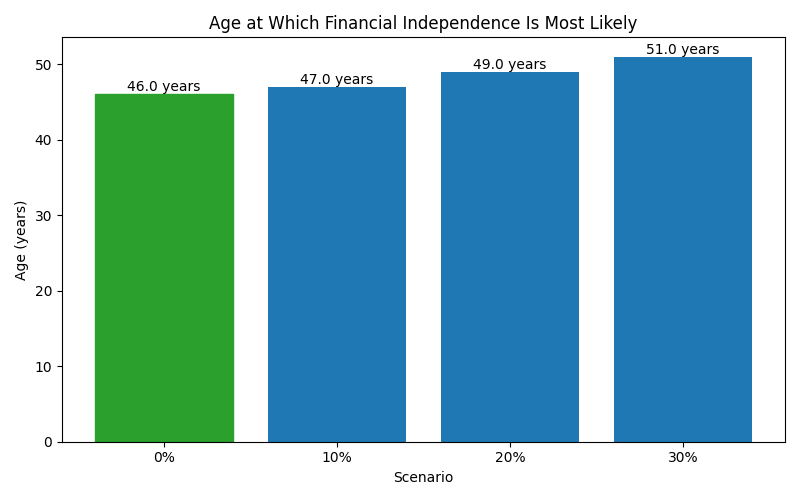
| 0% | 1,602,857 | 1,014,489 | 2,533,774 | 100% | 46 |
| 10% | 1,431,232 | 904,476 | 2,267,100 | 100% | 47 |
| 20% | 1,241,585 | 790,665 | 1,947,649 | 100% | 49 |
| 30% | 1,011,056 | 646,622 | 1,573,941 | 100% | 51 |
These charts show how each scenario affects long-term outcomes, including expected wealth, downside risk, and the likelihood of achieving financial independence.