Varied parameter
Saving rate
5% → 25%
Lawyer in Cluj-Napoca · Starting late
This page compares financial outcomes for a Lawyer living in Cluj-Napoca, Romania, following the Starting late life scenario.
A financial life that begins later, leaving fewer years for compounding to work. Success relies on disciplined saving, steady income, and sustained focus over a shorter horizon.
Cluj-Napoca combines strong tech opportunities with a high quality of life.
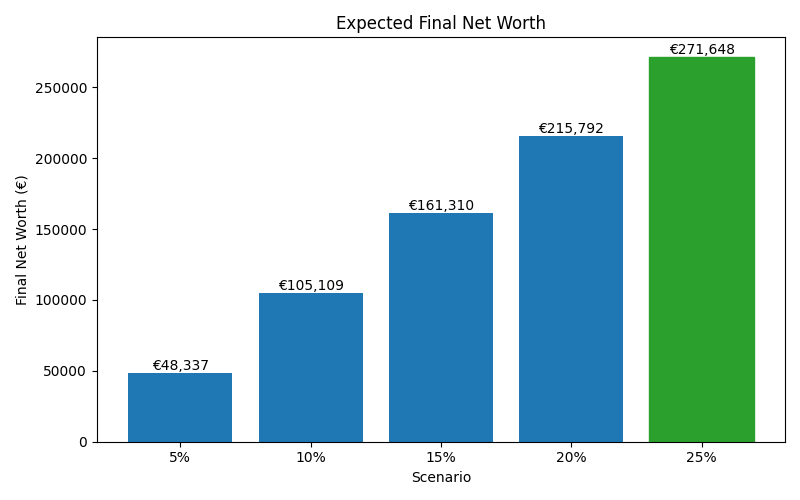
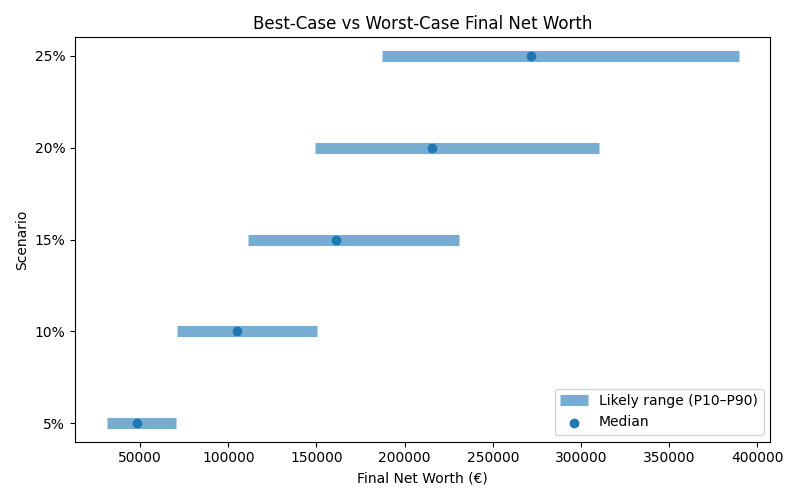
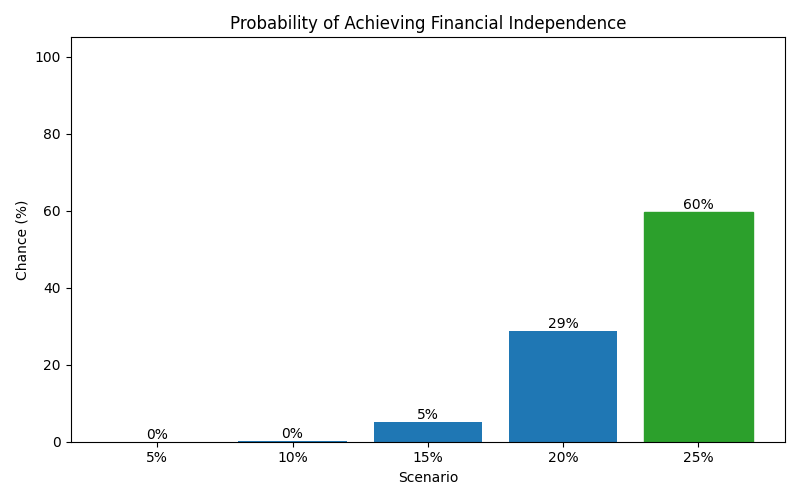
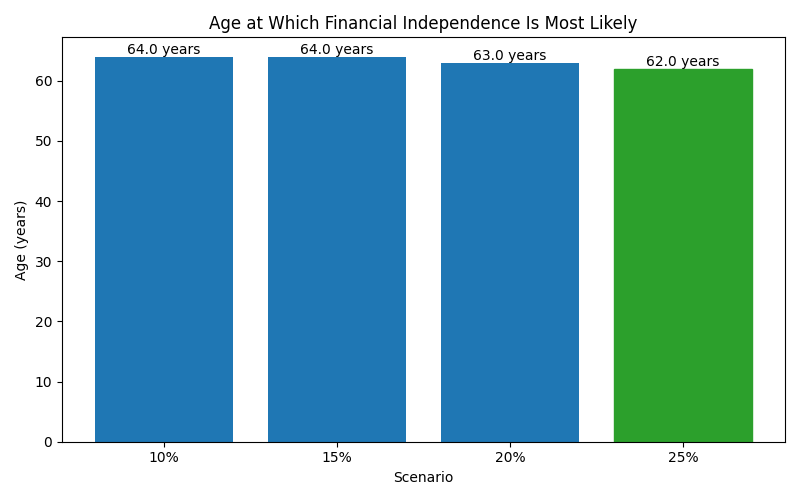
The comparison focuses on how changing the Saving rate influences long-term results, while all other assumptions remain constant.
Results are shown as a realistic range. P10 represents a pessimistic outcome, while P90 represents an optimistic outcome. Most simulations fall between these two values.
| Scenario | Median Net Worth | P10 Net Worth | P90 Net Worth | FI Probability | FI Median Age |
|---|---|---|---|---|---|
| 5% | 48,337 | 31,010 | 70,451 | 0% | — |
| 10% | 105,109 | 71,099 | 150,248 | 0% | 64 |
| 15% | 161,310 | 111,104 | 230,572 | 5% | 64 |
| 20% | 215,792 | 149,362 | 310,244 | 29% | 63 |
| 25% | 271,648 | 187,085 | 389,517 | 60% | 62 |
These charts show how each scenario affects long-term outcomes, including expected wealth, downside risk, and the likelihood of achieving financial independence.