Varied parameter
Saving rate
5% → 25%
Lawyer in Cluj-Napoca · Fast-track independence
This page compares financial outcomes for a Lawyer living in Cluj-Napoca, Romania, following the Fast-track independence life scenario.
A high-intensity saving and investing strategy aimed at reaching financial independence as early as possible. Strong outcomes require discipline, sacrifice, and tolerance for market risk.
Cluj-Napoca combines strong tech opportunities with a high quality of life.
The comparison focuses on how changing the Saving rate influences long-term results, while all other assumptions remain constant.
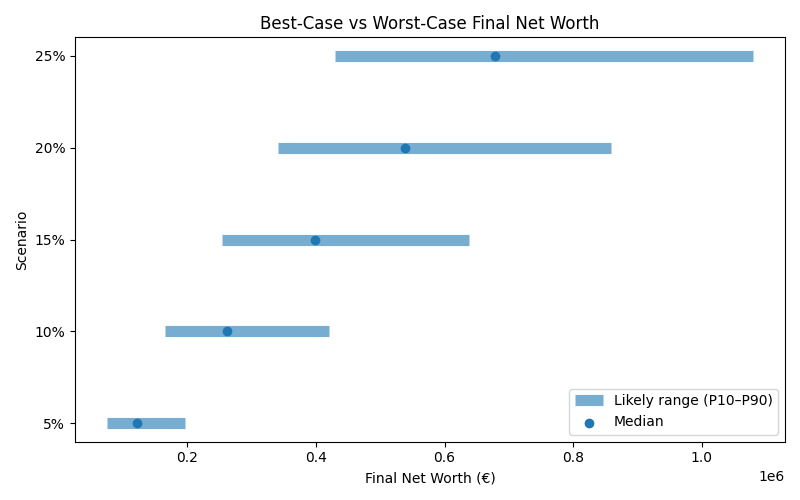
Results are shown as a realistic range. P10 represents a pessimistic outcome, while P90 represents an optimistic outcome. Most simulations fall between these two values.
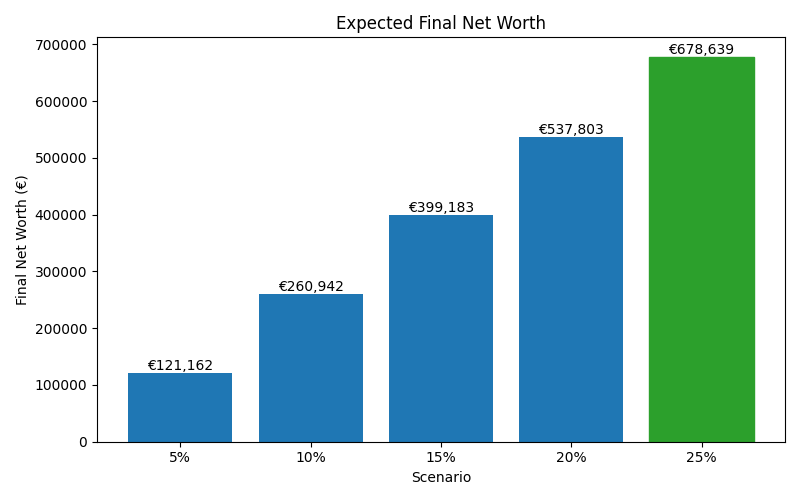
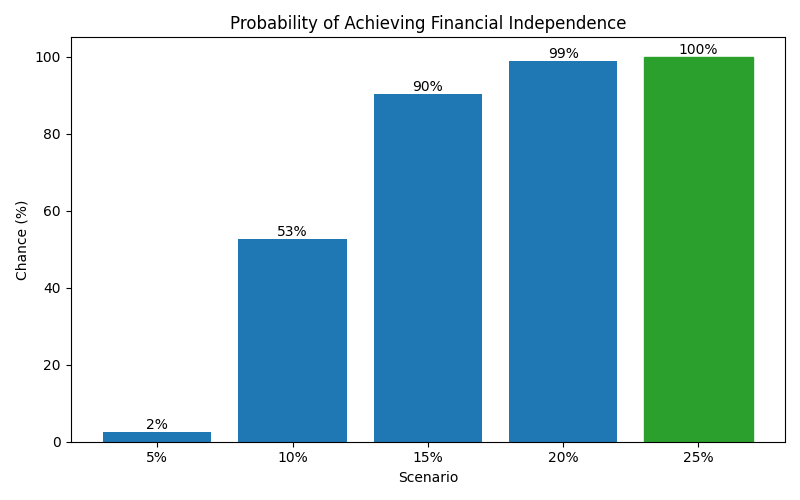
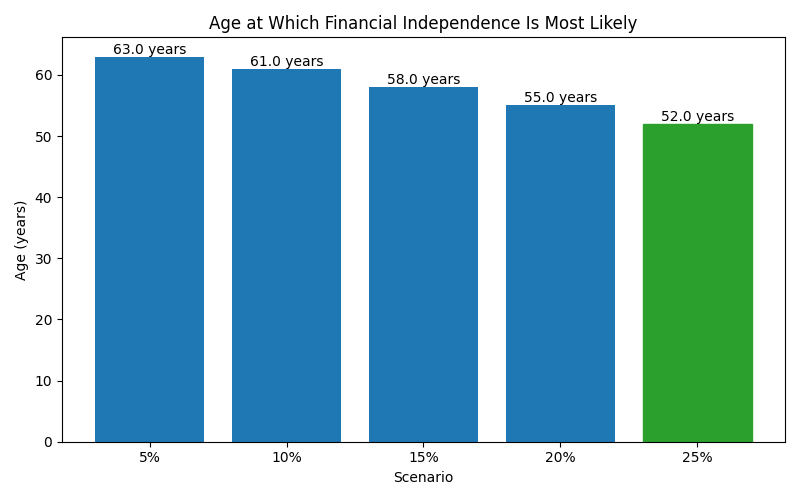
| Scenario | Median Net Worth | P10 Net Worth | P90 Net Worth | FI Probability | FI Median Age |
|---|---|---|---|---|---|
| 5% | 121,162 | 75,539 | 196,022 | 2% | 63 |
| 10% | 260,942 | 164,848 | 419,976 | 53% | 61 |
| 15% | 399,183 | 253,117 | 637,456 | 90% | 58 |
| 20% | 537,803 | 340,382 | 858,173 | 99% | 55 |
| 25% | 678,639 | 429,412 | 1,079,067 | 100% | 52 |
These charts show how each scenario affects long-term outcomes, including expected wealth, downside risk, and the likelihood of achieving financial independence.