Varied parameter
Income tax rate
0% → 30%
Lawyer in Munich · The steady builder
This page compares financial outcomes for a Lawyer living in Munich, Germany, following the The steady builder life scenario.
A balanced financial life built on predictable income growth, consistent saving, and long-term market participation. Progress comes from patience, stability, and compounding over time.
Munich offers very strong income potential in high-skill sectors, along with some of the highest living costs in Germany.
The comparison focuses on how changing the Income tax rate influences long-term results, while all other assumptions remain constant.
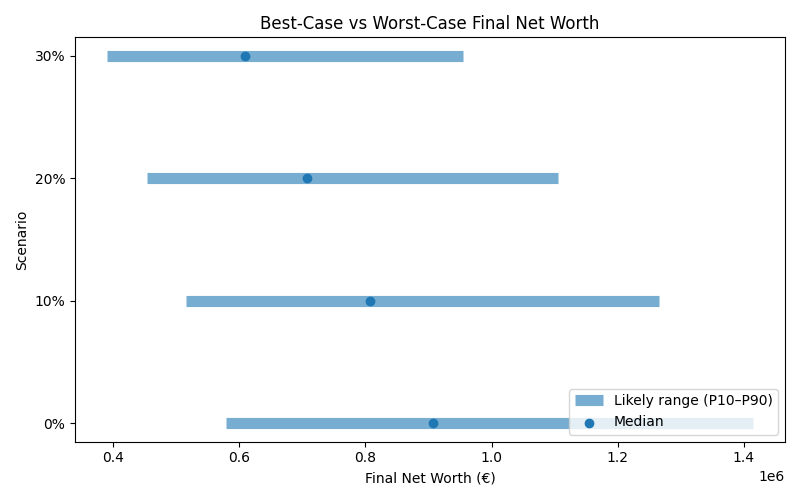
Results are shown as a realistic range. P10 represents a pessimistic outcome, while P90 represents an optimistic outcome. Most simulations fall between these two values.
| Scenario | Median Net Worth | P10 Net Worth | P90 Net Worth | FI Probability | FI Median Age |
|---|---|---|---|---|---|
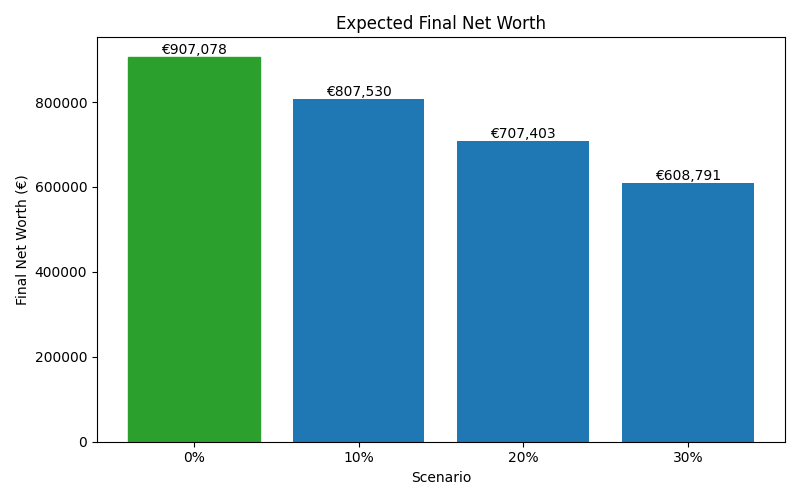
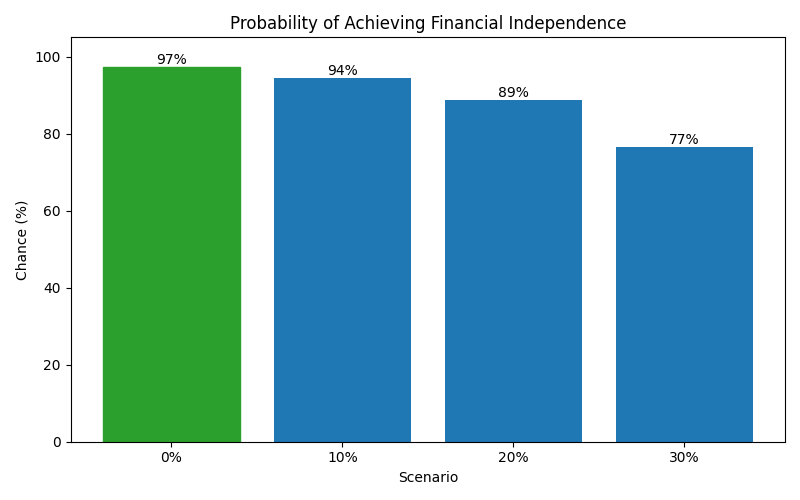
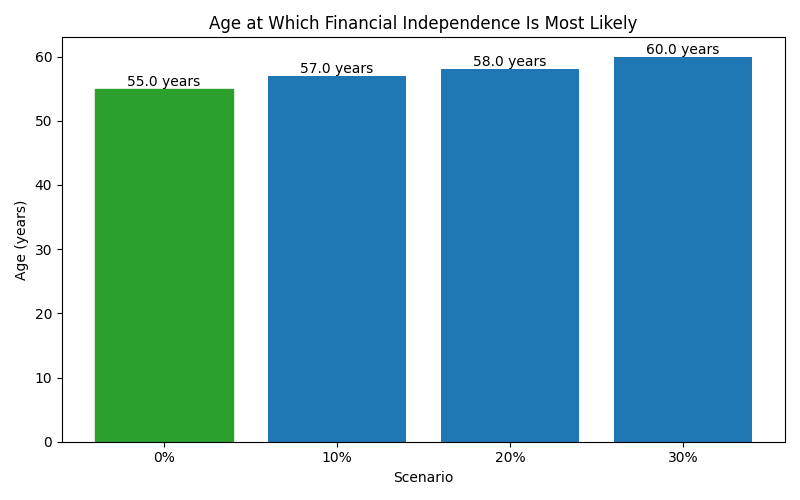
| 0% | 907,078 | 578,282 | 1,414,103 | 97% | 55 |
| 10% | 807,530 | 515,708 | 1,265,063 | 94% | 57 |
| 20% | 707,403 | 453,386 | 1,105,016 | 89% | 58 |
| 30% | 608,791 | 390,581 | 955,021 | 77% | 60 |
These charts show how each scenario affects long-term outcomes, including expected wealth, downside risk, and the likelihood of achieving financial independence.