Varied parameter
Saving rate
5% → 25%
Lawyer in Munich · The steady builder
This page compares financial outcomes for a Lawyer living in Munich, Germany, following the The steady builder life scenario.
A balanced financial life built on predictable income growth, consistent saving, and long-term market participation. Progress comes from patience, stability, and compounding over time.
Munich offers very strong income potential in high-skill sectors, along with some of the highest living costs in Germany.
The comparison focuses on how changing the Saving rate influences long-term results, while all other assumptions remain constant.
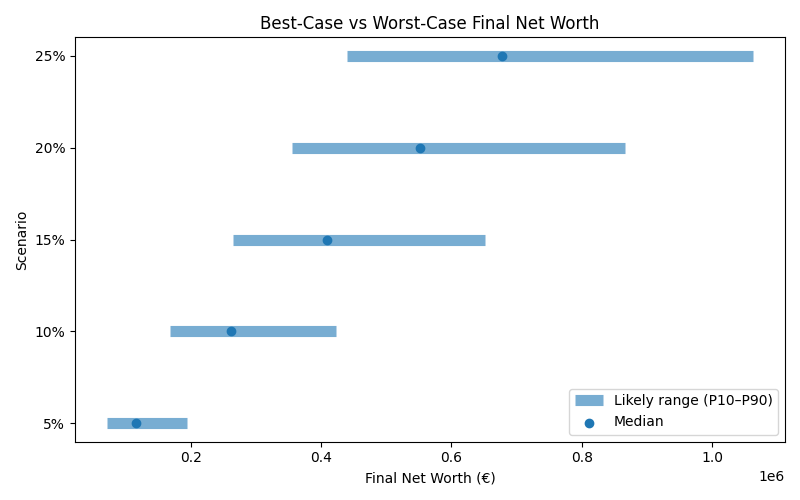
Results are shown as a realistic range. P10 represents a pessimistic outcome, while P90 represents an optimistic outcome. Most simulations fall between these two values.
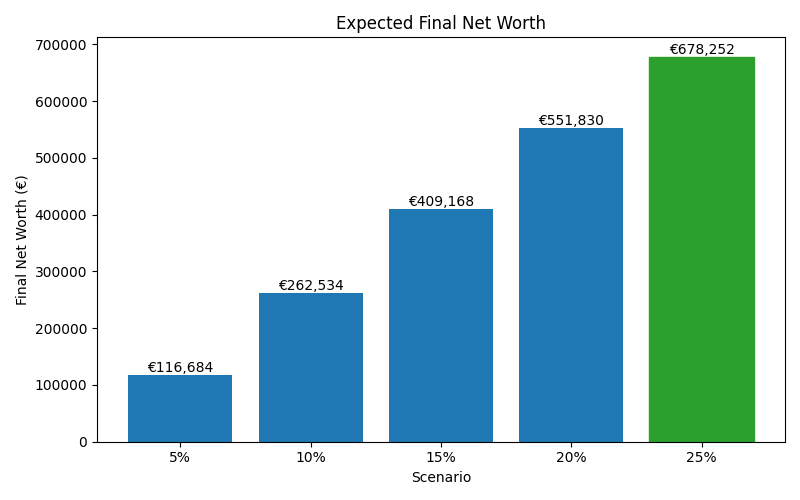
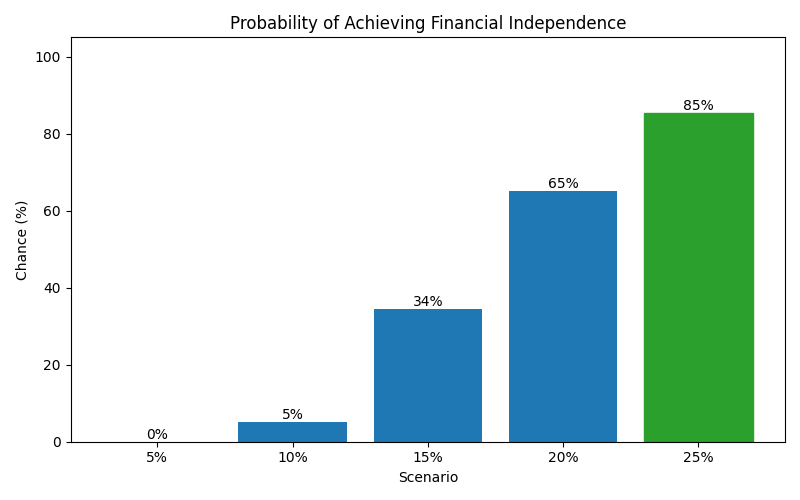
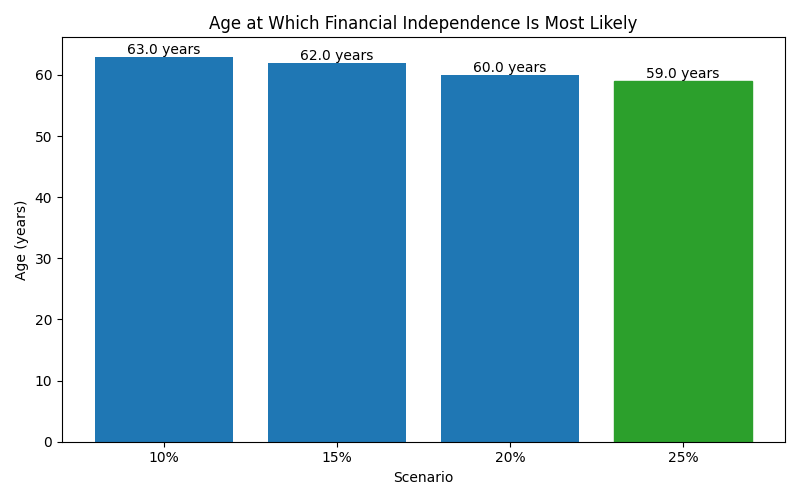
| Scenario | Median Net Worth | P10 Net Worth | P90 Net Worth | FI Probability | FI Median Age |
|---|---|---|---|---|---|
| 5% | 116,684 | 71,952 | 193,503 | 0% | — |
| 10% | 262,534 | 168,215 | 423,445 | 5% | 63 |
| 15% | 409,168 | 264,643 | 651,350 | 34% | 62 |
| 20% | 551,830 | 355,124 | 866,145 | 65% | 60 |
| 25% | 678,252 | 440,094 | 1,062,385 | 85% | 59 |
These charts show how each scenario affects long-term outcomes, including expected wealth, downside risk, and the likelihood of achieving financial independence.