Varied parameter
Saving rate
5% → 25%
Lawyer in Hamburg · Starting late
This page compares financial outcomes for a Lawyer living in Hamburg, Germany, following the Starting late life scenario.
A financial life that begins later, leaving fewer years for compounding to work. Success relies on disciplined saving, steady income, and sustained focus over a shorter horizon.
Hamburg has a strong professional services and logistics economy, with above-average costs and solid income potential.
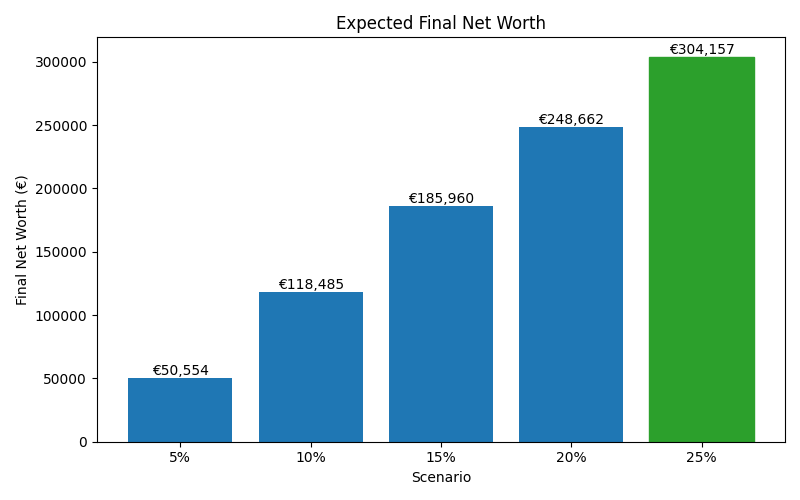
The comparison focuses on how changing the Saving rate influences long-term results, while all other assumptions remain constant.
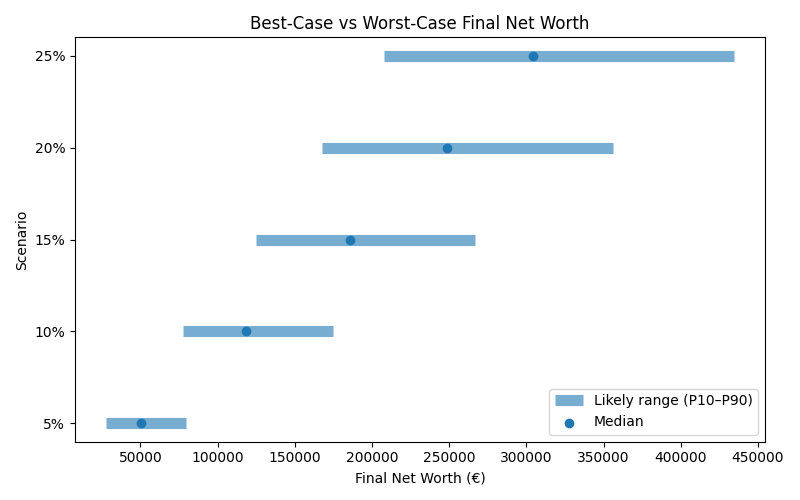
Results are shown as a realistic range. P10 represents a pessimistic outcome, while P90 represents an optimistic outcome. Most simulations fall between these two values.
| Scenario | Median Net Worth | P10 Net Worth | P90 Net Worth | FI Probability | FI Median Age |
|---|---|---|---|---|---|
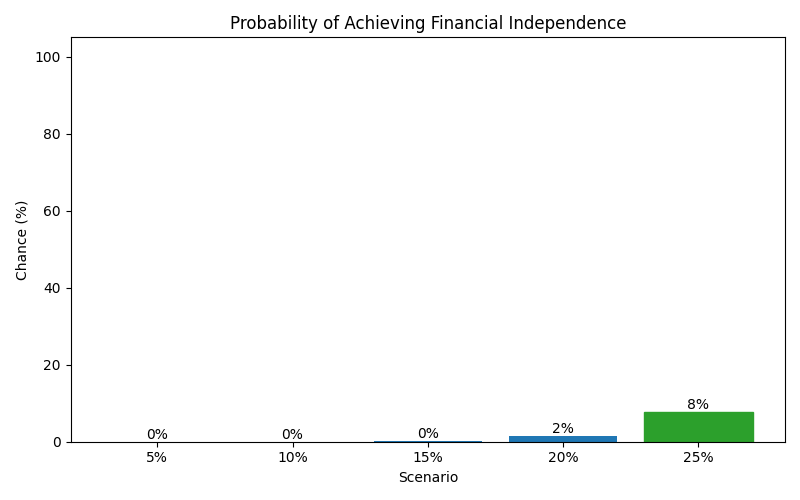
| 5% | 50,554 | 27,922 | 79,594 | 0% | — |
| 10% | 118,485 | 77,486 | 174,657 | 0% | — |
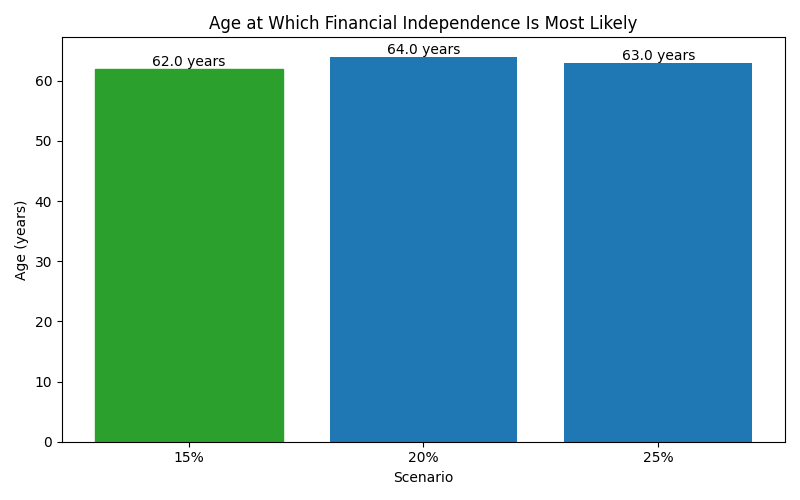
| 15% | 185,960 | 124,582 | 266,924 | 0% | 62 |
| 20% | 248,662 | 167,563 | 356,151 | 2% | 64 |
| 25% | 304,157 | 208,000 | 434,332 | 8% | 63 |
These charts show how each scenario affects long-term outcomes, including expected wealth, downside risk, and the likelihood of achieving financial independence.