Varied parameter
Saving rate
5% → 25%
Lawyer in Hamburg · Peak earning years
This page compares financial outcomes for a Lawyer living in Hamburg, Germany, following the Peak earning years life scenario.
A high-income trajectory with strong saving capacity and rapid wealth accumulation. Compounding works faster here, but results remain exposed to market cycles and timing.
Hamburg has a strong professional services and logistics economy, with above-average costs and solid income potential.
The comparison focuses on how changing the Saving rate influences long-term results, while all other assumptions remain constant.
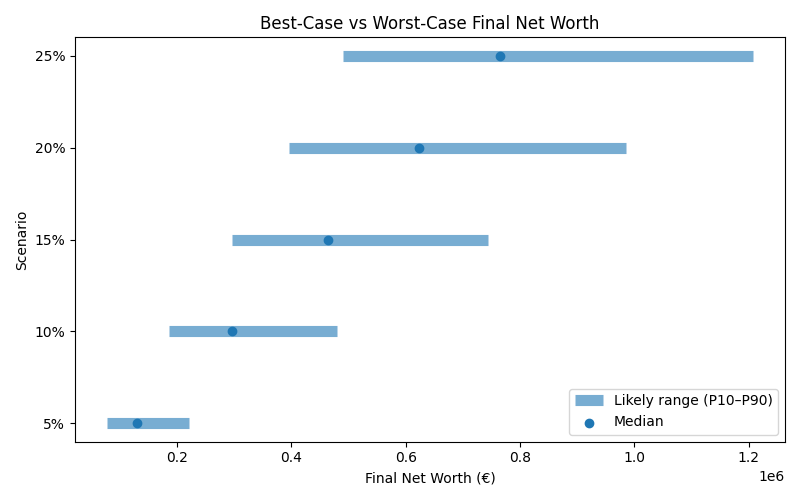
Results are shown as a realistic range. P10 represents a pessimistic outcome, while P90 represents an optimistic outcome. Most simulations fall between these two values.
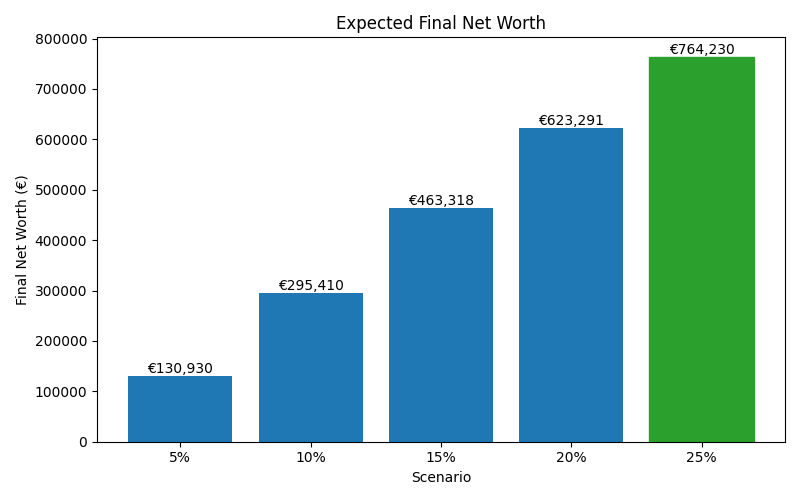
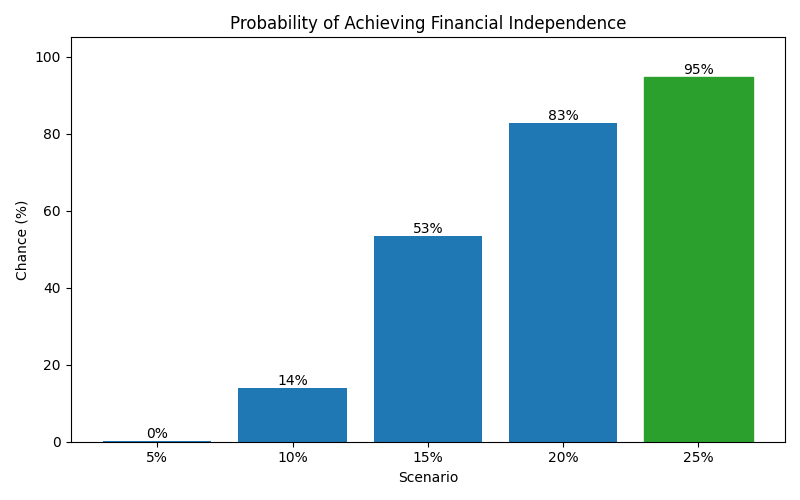
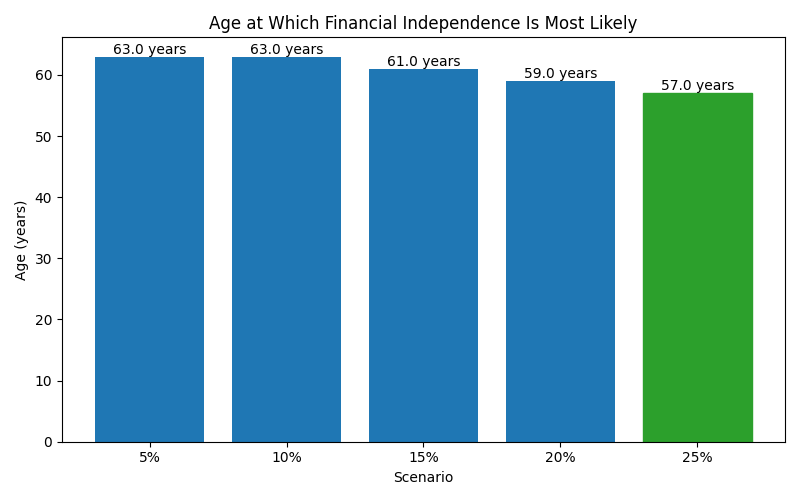
| Scenario | Median Net Worth | P10 Net Worth | P90 Net Worth | FI Probability | FI Median Age |
|---|---|---|---|---|---|
| 5% | 130,930 | 78,229 | 220,573 | 0% | 63 |
| 10% | 295,410 | 185,631 | 480,204 | 14% | 63 |
| 15% | 463,318 | 296,584 | 743,586 | 53% | 61 |
| 20% | 623,291 | 396,509 | 985,671 | 83% | 59 |
| 25% | 764,230 | 490,855 | 1,206,822 | 95% | 57 |
These charts show how each scenario affects long-term outcomes, including expected wealth, downside risk, and the likelihood of achieving financial independence.