Varied parameter
Income tax rate
0% → 30%
Lawyer in Berlin · The steady builder
This page compares financial outcomes for a Lawyer living in Berlin, Germany, following the The steady builder life scenario.
A balanced financial life built on predictable income growth, consistent saving, and long-term market participation. Progress comes from patience, stability, and compounding over time.
Berlin has a diverse economy with strong demand in technology and services, paired with a relatively high cost of living.
The comparison focuses on how changing the Income tax rate influences long-term results, while all other assumptions remain constant.
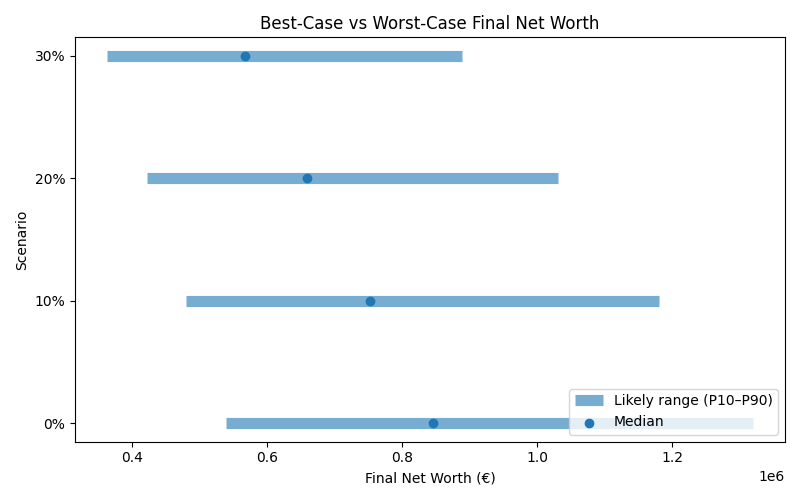
Results are shown as a realistic range. P10 represents a pessimistic outcome, while P90 represents an optimistic outcome. Most simulations fall between these two values.
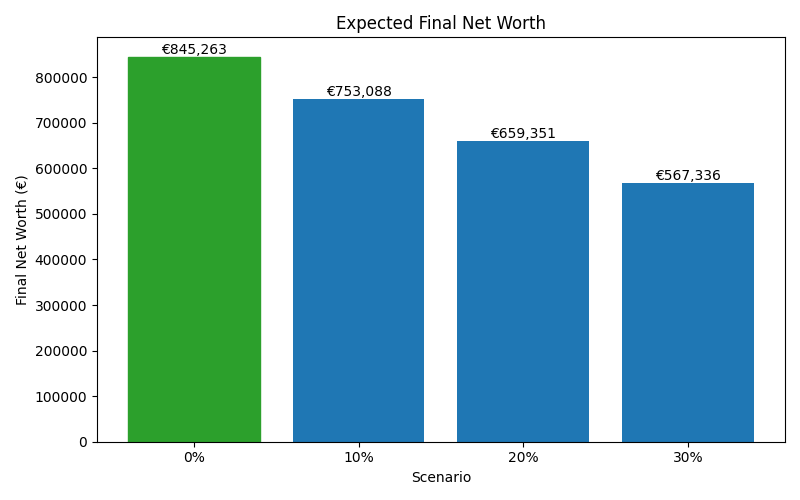
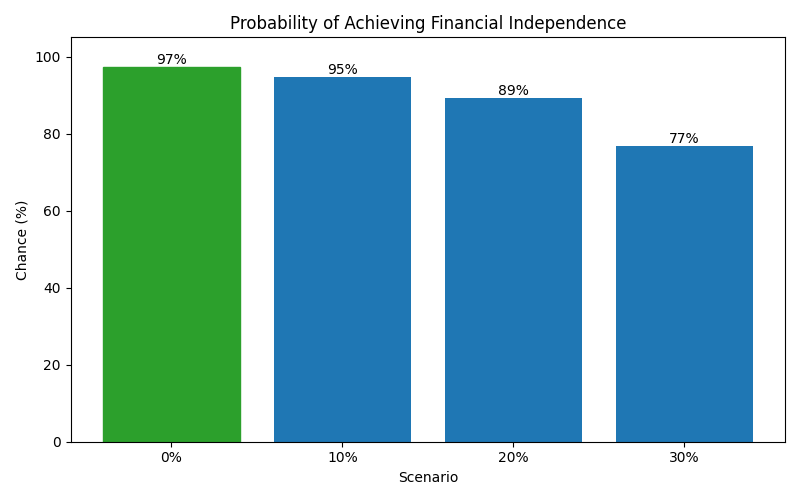
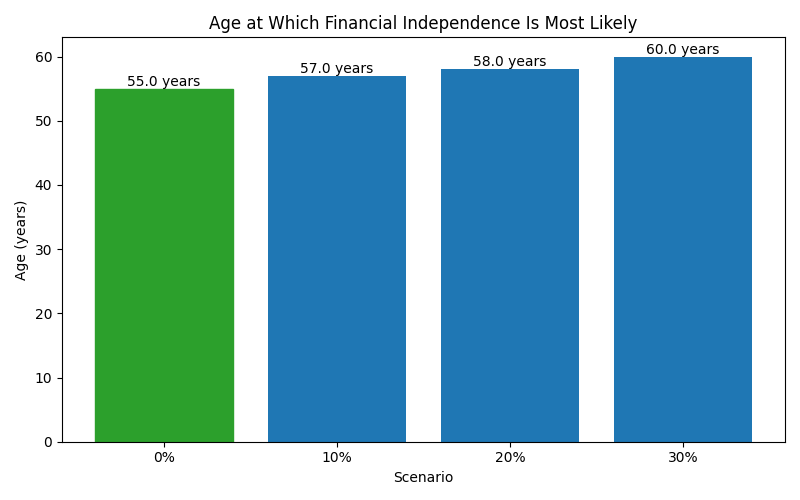
| Scenario | Median Net Worth | P10 Net Worth | P90 Net Worth | FI Probability | FI Median Age |
|---|---|---|---|---|---|
| 0% | 845,263 | 539,061 | 1,319,223 | 97% | 55 |
| 10% | 753,088 | 480,631 | 1,180,938 | 95% | 57 |
| 20% | 659,351 | 423,007 | 1,031,171 | 89% | 58 |
| 30% | 567,336 | 363,894 | 889,513 | 77% | 60 |
These charts show how each scenario affects long-term outcomes, including expected wealth, downside risk, and the likelihood of achieving financial independence.