Varied parameter
Saving rate
5% → 25%
Lawyer in Berlin · Peak earning years
This page compares financial outcomes for a Lawyer living in Berlin, Germany, following the Peak earning years life scenario.
A high-income trajectory with strong saving capacity and rapid wealth accumulation. Compounding works faster here, but results remain exposed to market cycles and timing.
Berlin has a diverse economy with strong demand in technology and services, paired with a relatively high cost of living.
The comparison focuses on how changing the Saving rate influences long-term results, while all other assumptions remain constant.
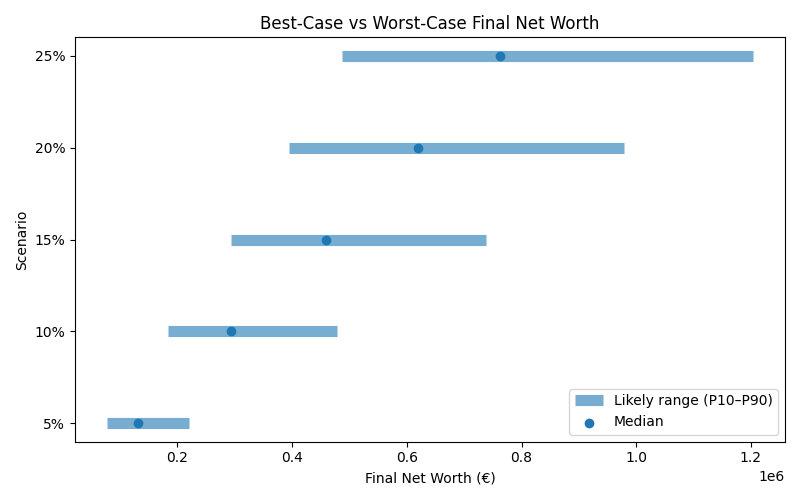
Results are shown as a realistic range. P10 represents a pessimistic outcome, while P90 represents an optimistic outcome. Most simulations fall between these two values.
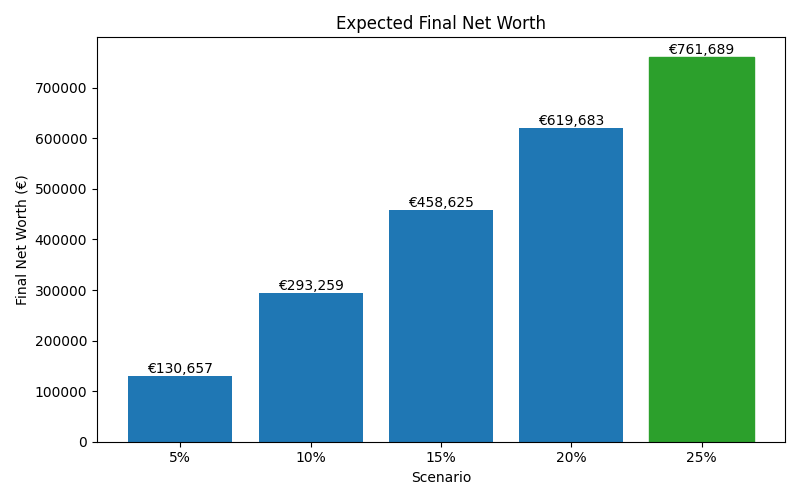
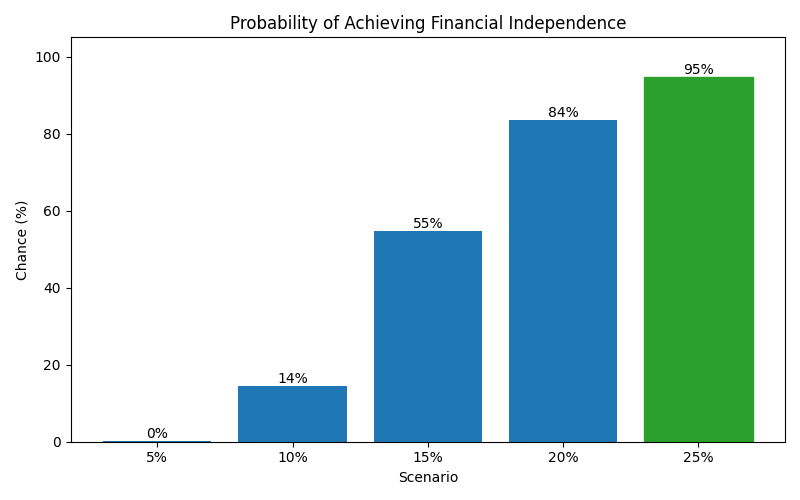
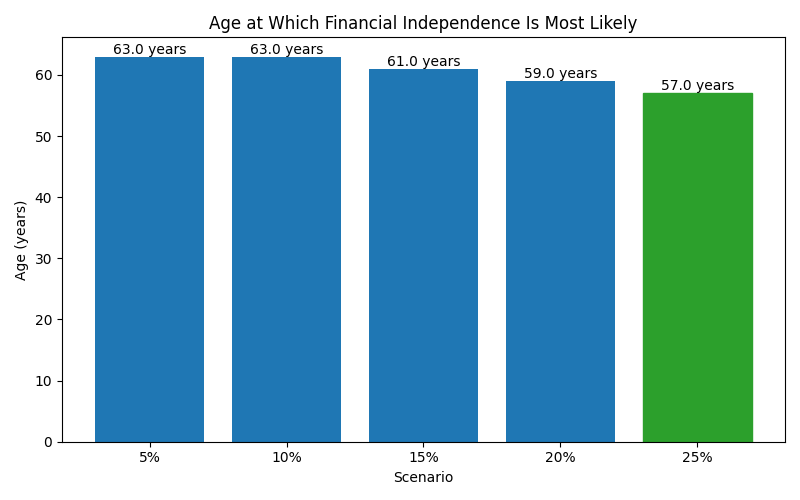
| Scenario | Median Net Worth | P10 Net Worth | P90 Net Worth | FI Probability | FI Median Age |
|---|---|---|---|---|---|
| 5% | 130,657 | 77,609 | 219,684 | 0% | 63 |
| 10% | 293,259 | 184,242 | 478,047 | 14% | 63 |
| 15% | 458,625 | 294,153 | 737,773 | 55% | 61 |
| 20% | 619,683 | 394,409 | 979,438 | 84% | 59 |
| 25% | 761,689 | 487,652 | 1,203,256 | 95% | 57 |
These charts show how each scenario affects long-term outcomes, including expected wealth, downside risk, and the likelihood of achieving financial independence.