Varied parameter
Income tax rate
0% → 30%
Freelancer / Contractor in Madrid · A volatile financial ride
This page compares financial outcomes for a Freelancer / Contractor living in Madrid, Spain, following the A volatile financial ride life scenario.
A highly unstable financial path combining income uncertainty, market swings, and repeated adverse events. Outcomes range widely, from recovery and growth to prolonged stagnation.
Madrid concentrates many higher-paying roles and business opportunities, with a correspondingly higher urban cost structure.
The comparison focuses on how changing the Income tax rate influences long-term results, while all other assumptions remain constant.
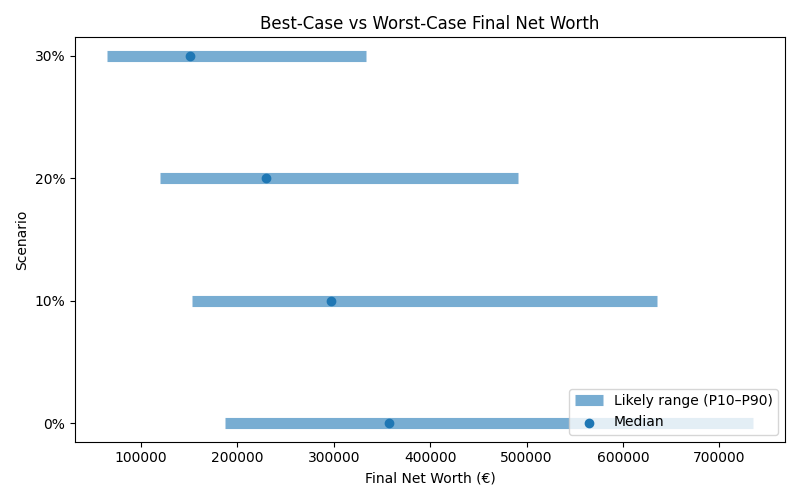
Results are shown as a realistic range. P10 represents a pessimistic outcome, while P90 represents an optimistic outcome. Most simulations fall between these two values.
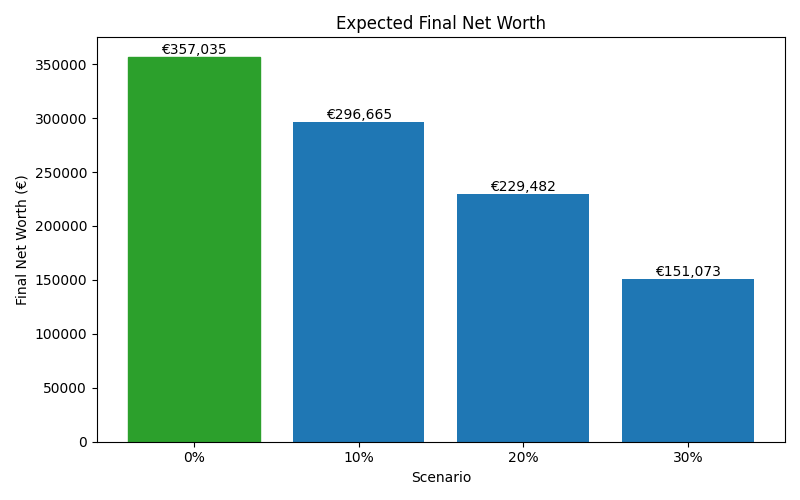
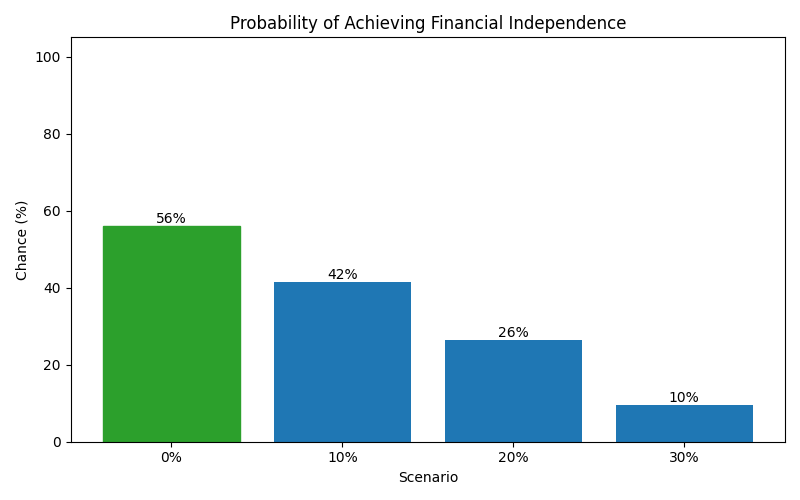
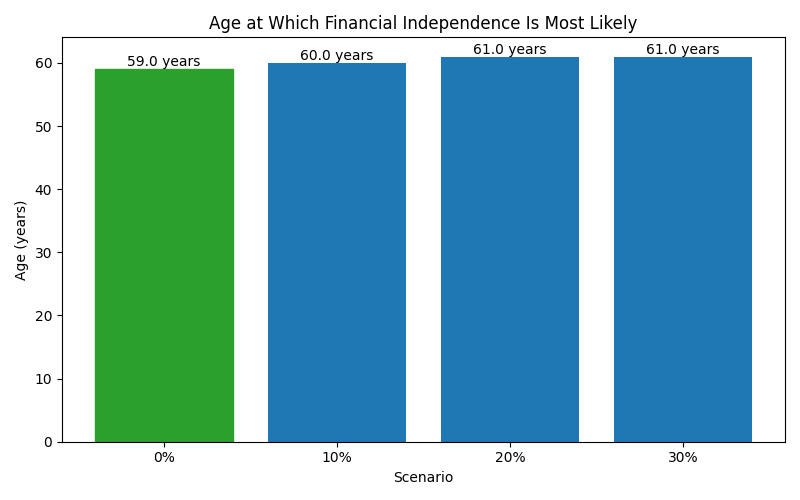
| Scenario | Median Net Worth | P10 Net Worth | P90 Net Worth | FI Probability | FI Median Age |
|---|---|---|---|---|---|
| 0% | 357,035 | 187,303 | 734,679 | 56% | 59 |
| 10% | 296,665 | 152,701 | 634,931 | 42% | 60 |
| 20% | 229,482 | 119,435 | 491,223 | 26% | 61 |
| 30% | 151,073 | 65,008 | 333,661 | 10% | 61 |
These charts show how each scenario affects long-term outcomes, including expected wealth, downside risk, and the likelihood of achieving financial independence.