Varied parameter
Investment return (expected)
3% → 7%
Freelancer / Contractor in Madrid · Peak earning years
This page compares financial outcomes for a Freelancer / Contractor living in Madrid, Spain, following the Peak earning years life scenario.
A high-income trajectory with strong saving capacity and rapid wealth accumulation. Compounding works faster here, but results remain exposed to market cycles and timing.
Madrid concentrates many higher-paying roles and business opportunities, with a correspondingly higher urban cost structure.
The comparison focuses on how changing the Investment return (expected) influences long-term results, while all other assumptions remain constant.
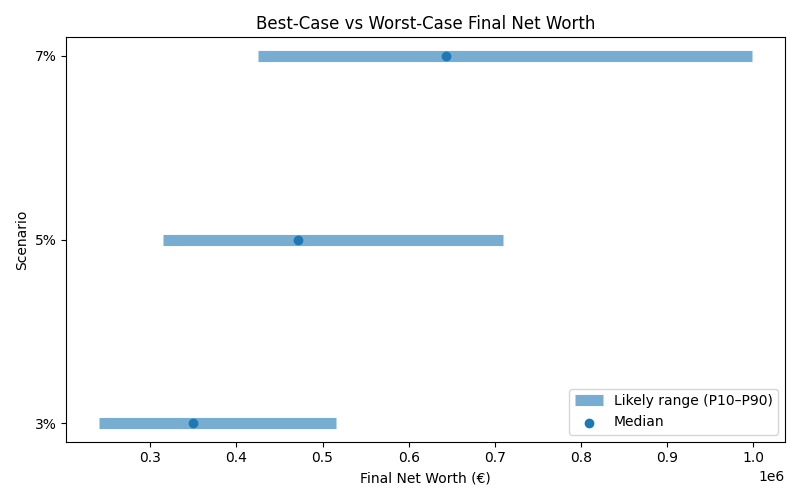
Results are shown as a realistic range. P10 represents a pessimistic outcome, while P90 represents an optimistic outcome. Most simulations fall between these two values.
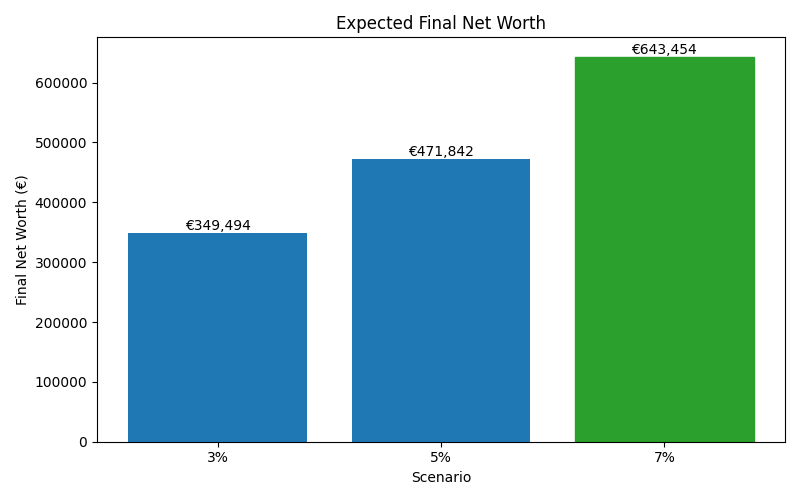
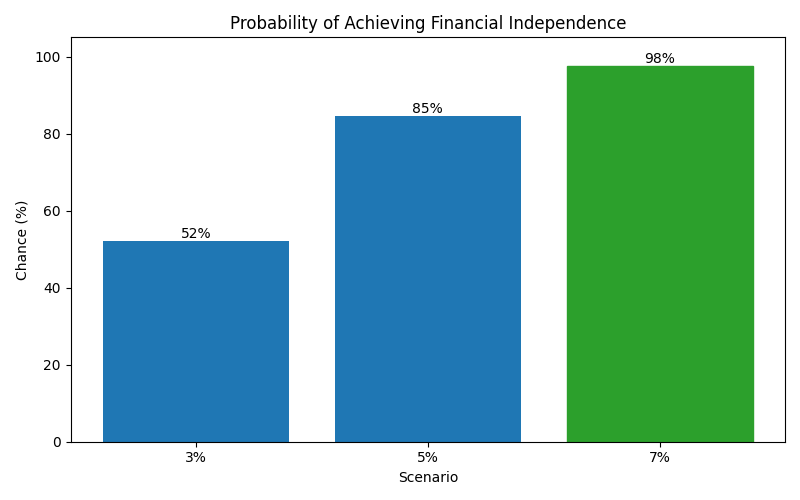
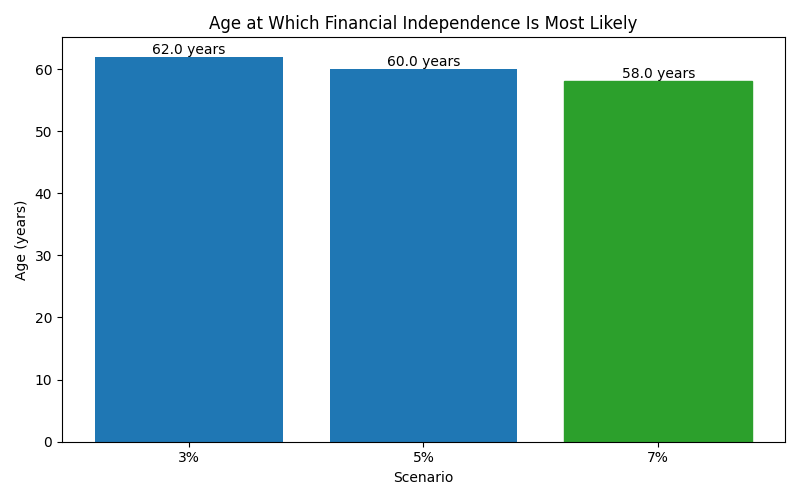
| Scenario | Median Net Worth | P10 Net Worth | P90 Net Worth | FI Probability | FI Median Age |
|---|---|---|---|---|---|
| 3% | 349,494 | 240,298 | 516,037 | 52% | 62 |
| 5% | 471,842 | 314,848 | 709,362 | 85% | 60 |
| 7% | 643,454 | 424,633 | 999,001 | 98% | 58 |
These charts show how each scenario affects long-term outcomes, including expected wealth, downside risk, and the likelihood of achieving financial independence.