Varied parameter
Income tax rate
0% → 30%
Freelancer / Contractor in Madrid · Independent and uneven
This page compares financial outcomes for a Freelancer / Contractor living in Madrid, Spain, following the Independent and uneven life scenario.
A non-linear income path shaped by project-based work, variability, and self-managed risk. Flexibility is high, but consistency must be actively created rather than assumed.
Madrid concentrates many higher-paying roles and business opportunities, with a correspondingly higher urban cost structure.
The comparison focuses on how changing the Income tax rate influences long-term results, while all other assumptions remain constant.
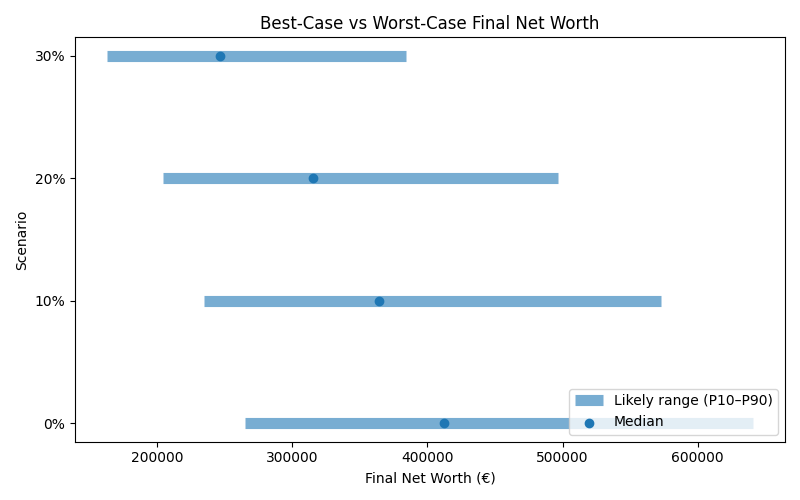
Results are shown as a realistic range. P10 represents a pessimistic outcome, while P90 represents an optimistic outcome. Most simulations fall between these two values.
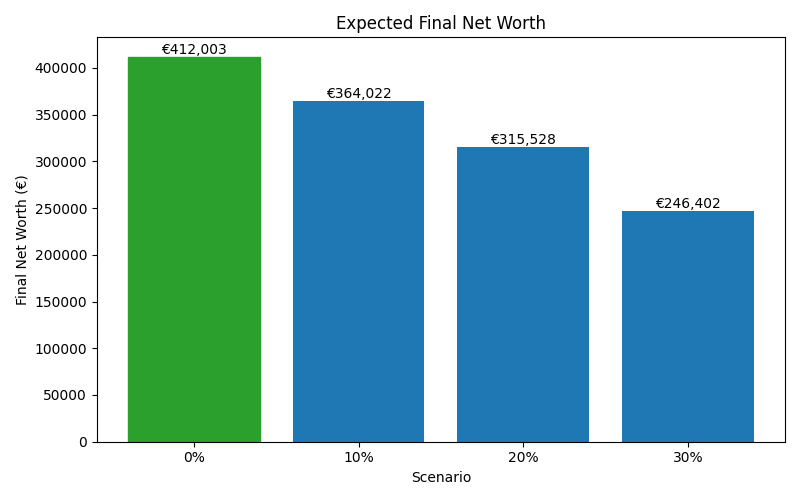
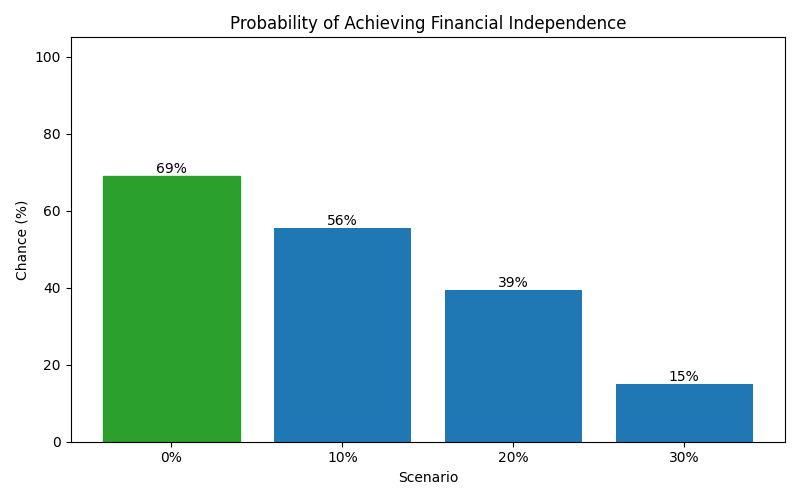
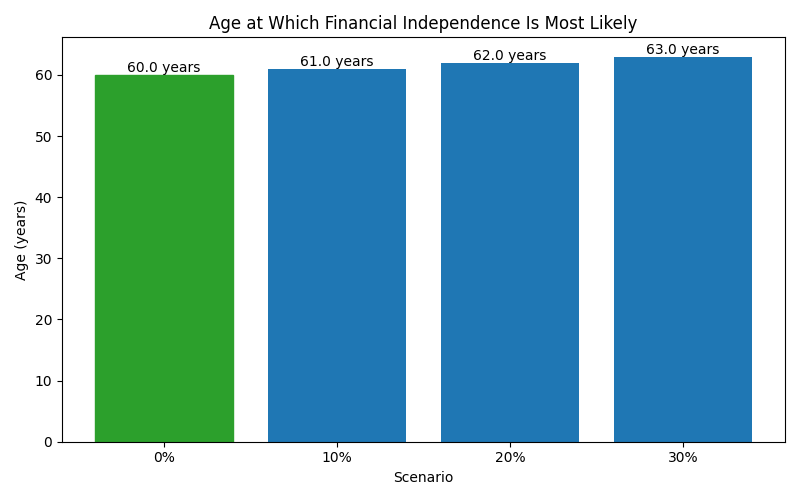
| Scenario | Median Net Worth | P10 Net Worth | P90 Net Worth | FI Probability | FI Median Age |
|---|---|---|---|---|---|
| 0% | 412,003 | 265,098 | 640,633 | 69% | 60 |
| 10% | 364,022 | 234,862 | 572,780 | 56% | 61 |
| 20% | 315,528 | 204,475 | 496,892 | 39% | 62 |
| 30% | 246,402 | 163,357 | 384,581 | 15% | 63 |
These charts show how each scenario affects long-term outcomes, including expected wealth, downside risk, and the likelihood of achieving financial independence.