Varied parameter
Income growth (annual)
1% → 5%
Freelancer / Contractor in Madrid · Independent and uneven
This page compares financial outcomes for a Freelancer / Contractor living in Madrid, Spain, following the Independent and uneven life scenario.
A non-linear income path shaped by project-based work, variability, and self-managed risk. Flexibility is high, but consistency must be actively created rather than assumed.
Madrid concentrates many higher-paying roles and business opportunities, with a correspondingly higher urban cost structure.
The comparison focuses on how changing the Income growth (annual) influences long-term results, while all other assumptions remain constant.
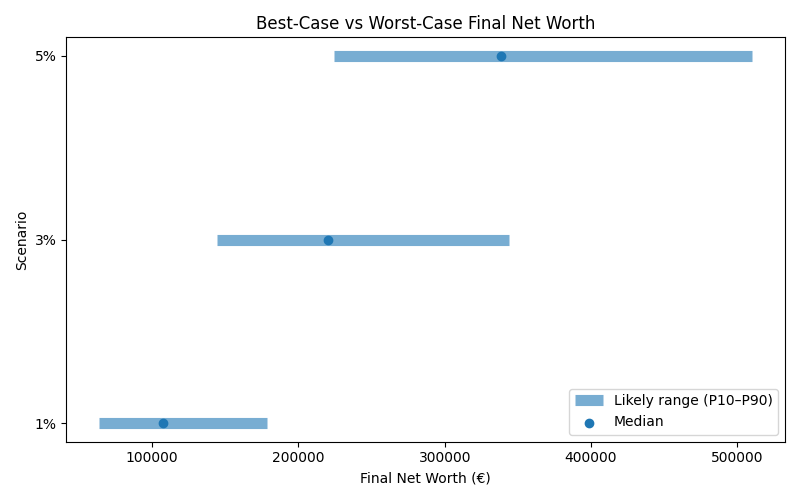
Results are shown as a realistic range. P10 represents a pessimistic outcome, while P90 represents an optimistic outcome. Most simulations fall between these two values.
| Scenario | Median Net Worth | P10 Net Worth | P90 Net Worth | FI Probability | FI Median Age |
|---|---|---|---|---|---|
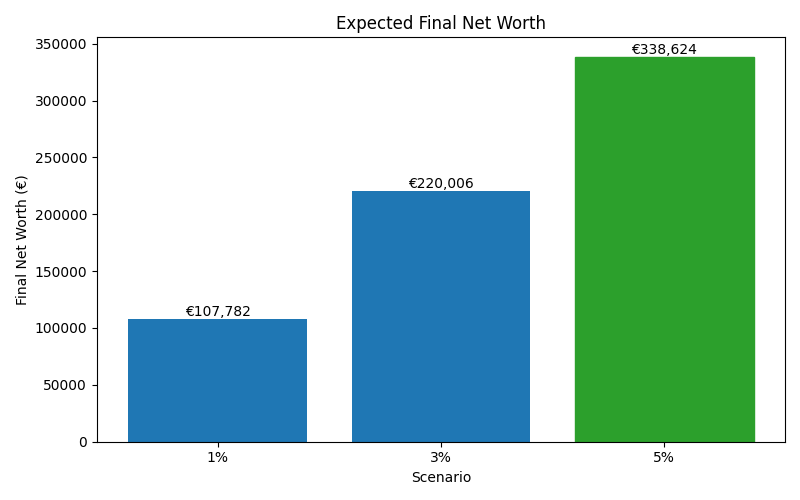
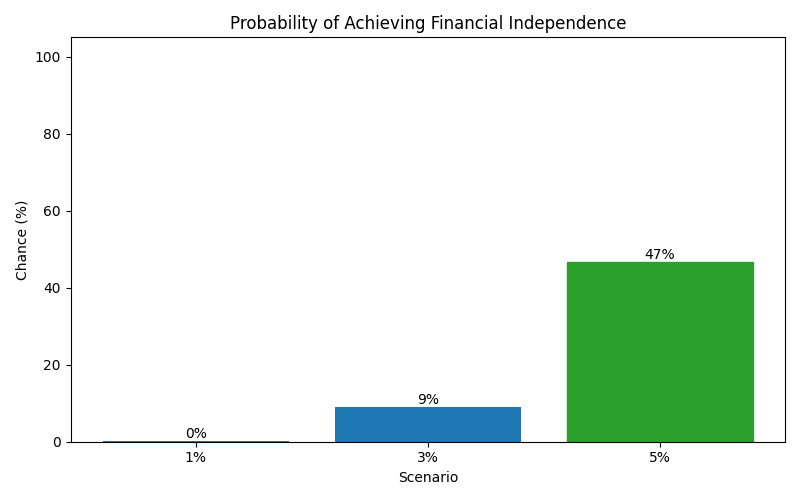
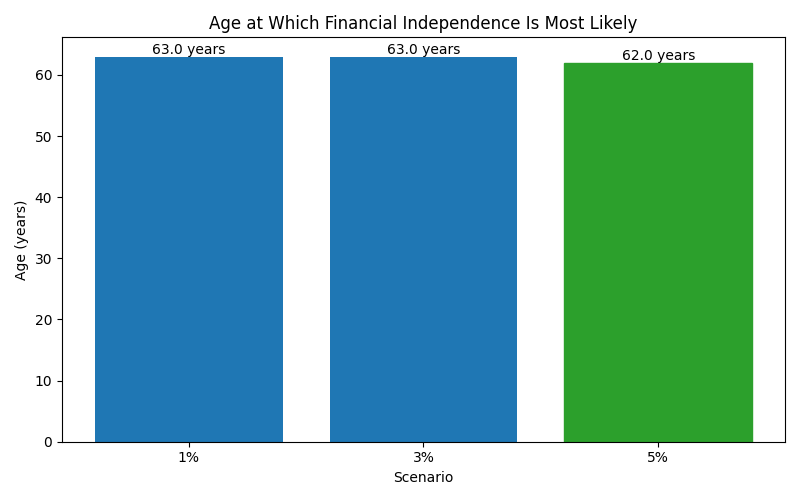
| 1% | 107,782 | 63,735 | 178,583 | 0% | 63 |
| 3% | 220,006 | 144,303 | 343,934 | 9% | 63 |
| 5% | 338,624 | 224,215 | 510,203 | 47% | 62 |
These charts show how each scenario affects long-term outcomes, including expected wealth, downside risk, and the likelihood of achieving financial independence.