Varied parameter
Saving rate
5% → 25%
Freelancer / Contractor in Madrid · Fast-track independence
This page compares financial outcomes for a Freelancer / Contractor living in Madrid, Spain, following the Fast-track independence life scenario.
A high-intensity saving and investing strategy aimed at reaching financial independence as early as possible. Strong outcomes require discipline, sacrifice, and tolerance for market risk.
Madrid concentrates many higher-paying roles and business opportunities, with a correspondingly higher urban cost structure.
The comparison focuses on how changing the Saving rate influences long-term results, while all other assumptions remain constant.
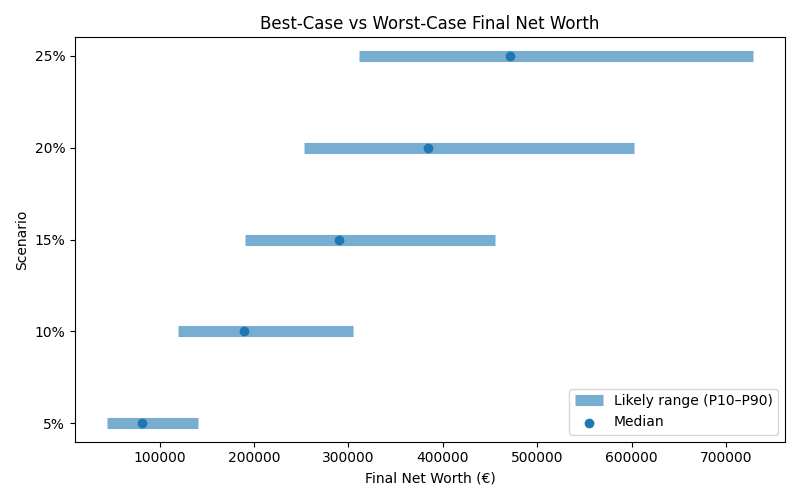
Results are shown as a realistic range. P10 represents a pessimistic outcome, while P90 represents an optimistic outcome. Most simulations fall between these two values.
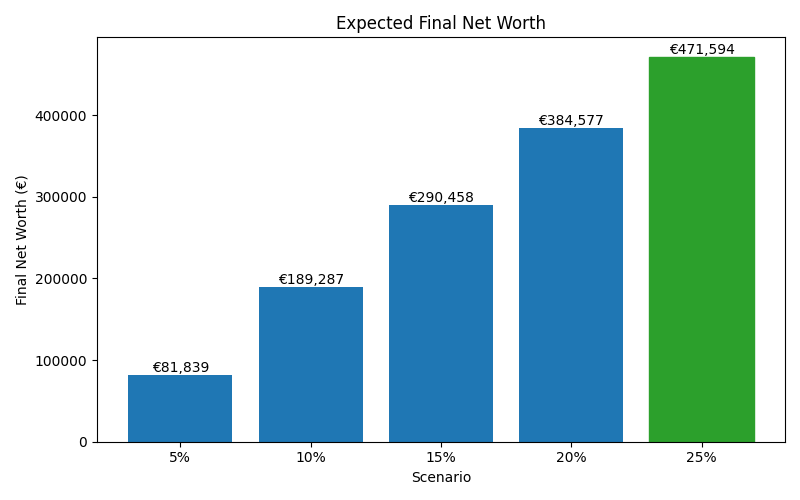
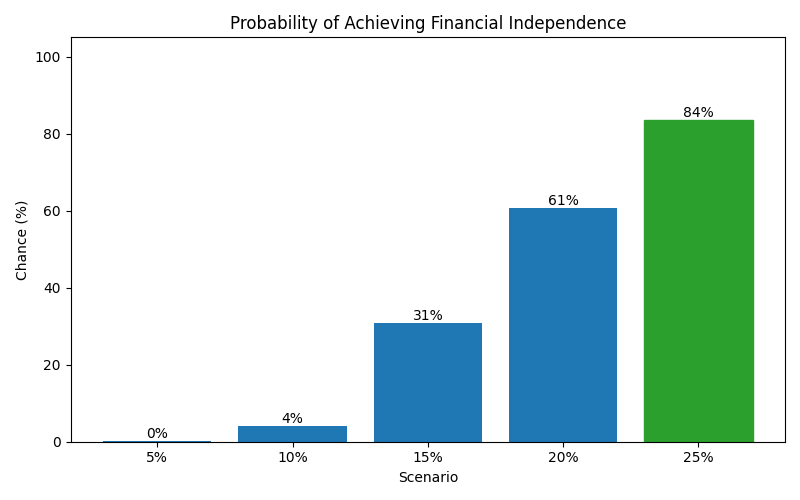
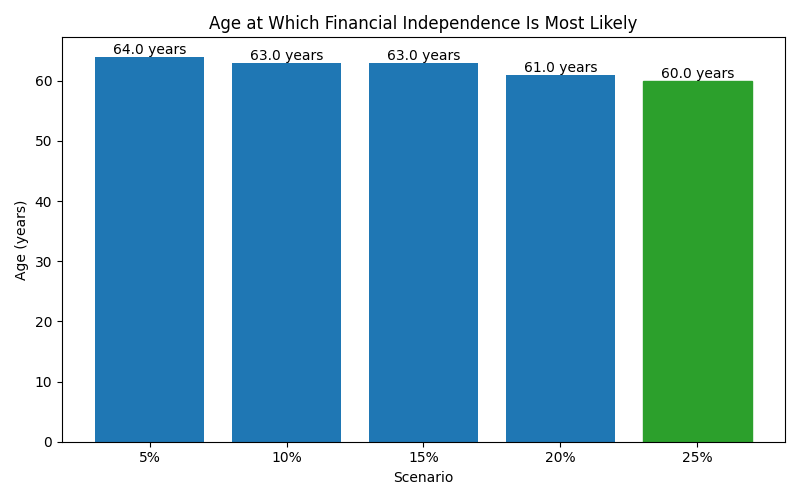
| Scenario | Median Net Worth | P10 Net Worth | P90 Net Worth | FI Probability | FI Median Age |
|---|---|---|---|---|---|
| 5% | 81,839 | 44,728 | 140,666 | 0% | 64 |
| 10% | 189,287 | 119,431 | 305,159 | 4% | 63 |
| 15% | 290,458 | 190,832 | 455,501 | 31% | 63 |
| 20% | 384,577 | 253,300 | 602,488 | 61% | 61 |
| 25% | 471,594 | 310,773 | 728,062 | 84% | 60 |
These charts show how each scenario affects long-term outcomes, including expected wealth, downside risk, and the likelihood of achieving financial independence.