Varied parameter
Income tax rate
0% → 30%
Freelancer / Contractor in Barcelona · A volatile financial ride
This page compares financial outcomes for a Freelancer / Contractor living in Barcelona, Spain, following the A volatile financial ride life scenario.
A highly unstable financial path combining income uncertainty, market swings, and repeated adverse events. Outcomes range widely, from recovery and growth to prolonged stagnation.
Barcelona combines a broad service and tech market with elevated living costs relative to the Spanish national average.
The comparison focuses on how changing the Income tax rate influences long-term results, while all other assumptions remain constant.
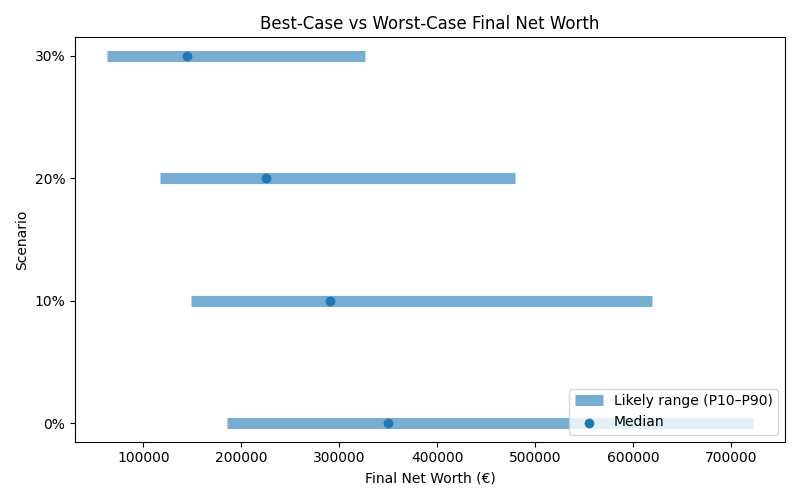
Results are shown as a realistic range. P10 represents a pessimistic outcome, while P90 represents an optimistic outcome. Most simulations fall between these two values.
| Scenario | Median Net Worth | P10 Net Worth | P90 Net Worth | FI Probability | FI Median Age |
|---|---|---|---|---|---|
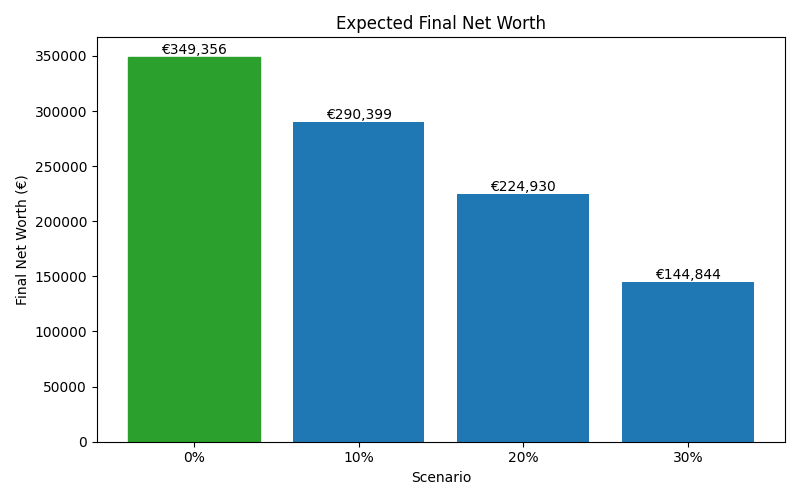
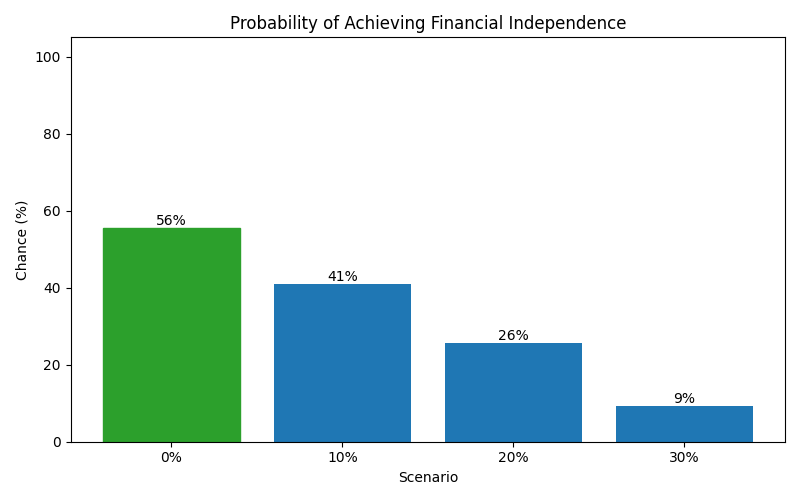
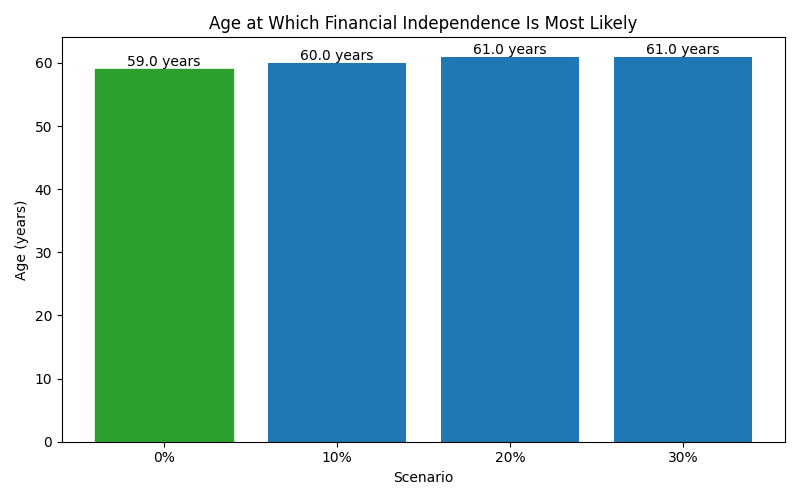
| 0% | 349,356 | 185,145 | 722,107 | 56% | 59 |
| 10% | 290,399 | 149,109 | 618,967 | 41% | 60 |
| 20% | 224,930 | 117,337 | 478,960 | 26% | 61 |
| 30% | 144,844 | 63,192 | 326,325 | 9% | 61 |
These charts show how each scenario affects long-term outcomes, including expected wealth, downside risk, and the likelihood of achieving financial independence.