Varied parameter
Income tax rate
0% → 30%
Freelancer / Contractor in Barcelona · Peak earning years
This page compares financial outcomes for a Freelancer / Contractor living in Barcelona, Spain, following the Peak earning years life scenario.
A high-income trajectory with strong saving capacity and rapid wealth accumulation. Compounding works faster here, but results remain exposed to market cycles and timing.
Barcelona combines a broad service and tech market with elevated living costs relative to the Spanish national average.
The comparison focuses on how changing the Income tax rate influences long-term results, while all other assumptions remain constant.
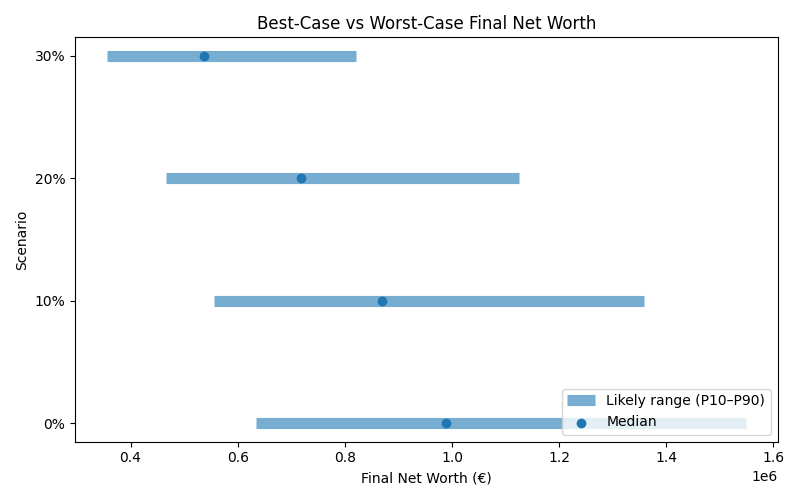
Results are shown as a realistic range. P10 represents a pessimistic outcome, while P90 represents an optimistic outcome. Most simulations fall between these two values.
| Scenario | Median Net Worth | P10 Net Worth | P90 Net Worth | FI Probability | FI Median Age |
|---|---|---|---|---|---|
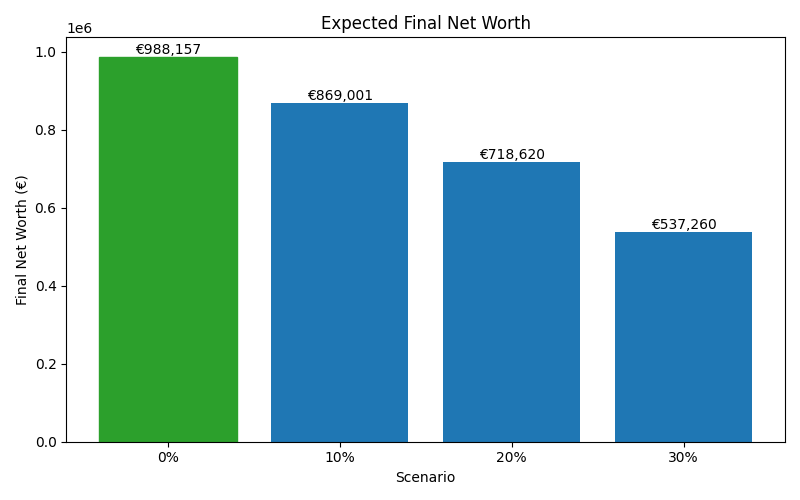
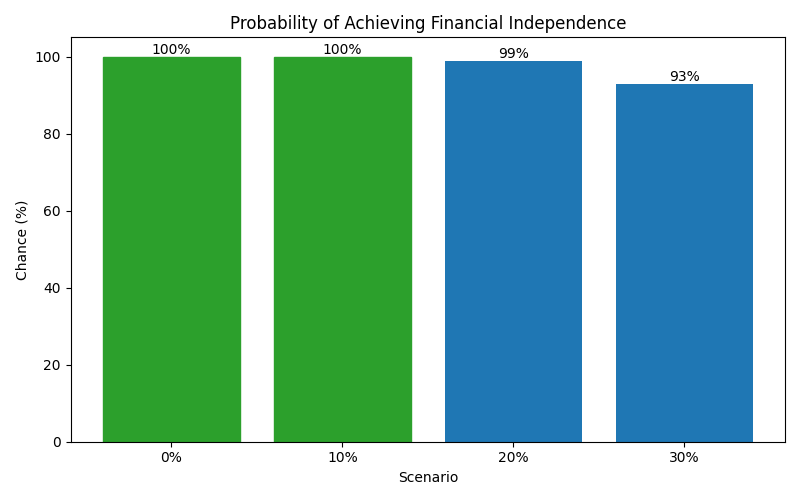
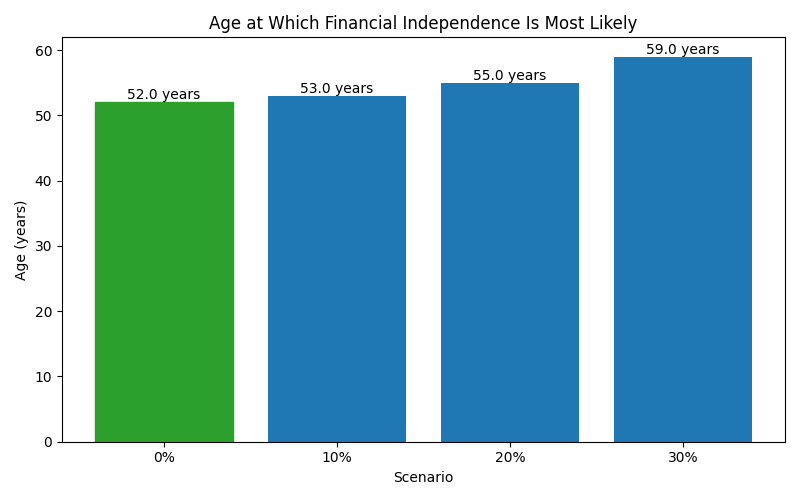
| 0% | 988,157 | 634,503 | 1,548,309 | 100% | 52 |
| 10% | 869,001 | 555,218 | 1,358,087 | 100% | 53 |
| 20% | 718,620 | 465,955 | 1,124,317 | 99% | 55 |
| 30% | 537,260 | 355,971 | 821,299 | 93% | 59 |
These charts show how each scenario affects long-term outcomes, including expected wealth, downside risk, and the likelihood of achieving financial independence.