Varied parameter
Income tax rate
0% → 30%
Freelancer / Contractor in Barcelona · Independent and uneven
This page compares financial outcomes for a Freelancer / Contractor living in Barcelona, Spain, following the Independent and uneven life scenario.
A non-linear income path shaped by project-based work, variability, and self-managed risk. Flexibility is high, but consistency must be actively created rather than assumed.
Barcelona combines a broad service and tech market with elevated living costs relative to the Spanish national average.
The comparison focuses on how changing the Income tax rate influences long-term results, while all other assumptions remain constant.
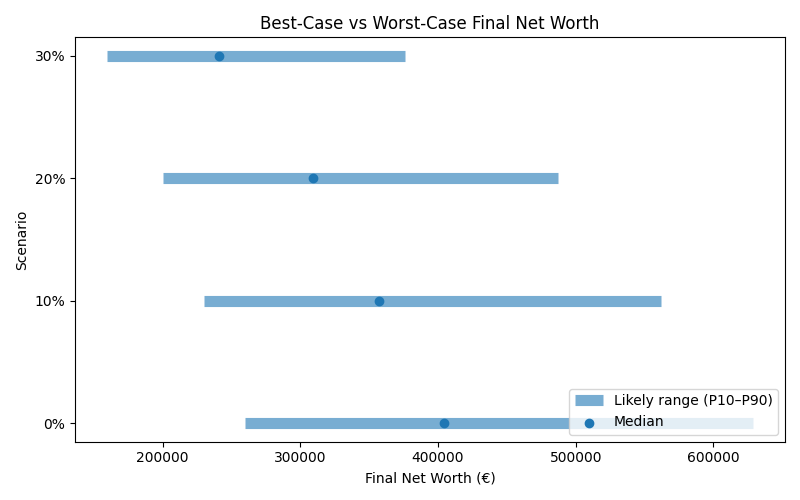
Results are shown as a realistic range. P10 represents a pessimistic outcome, while P90 represents an optimistic outcome. Most simulations fall between these two values.
| Scenario | Median Net Worth | P10 Net Worth | P90 Net Worth | FI Probability | FI Median Age |
|---|---|---|---|---|---|
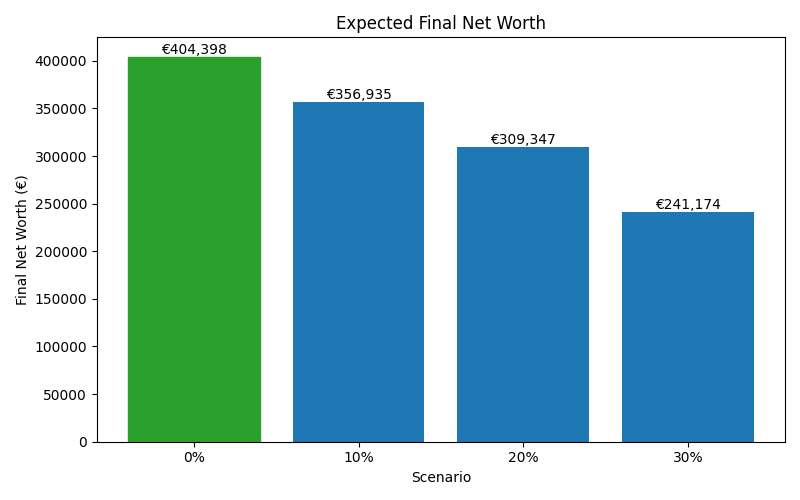
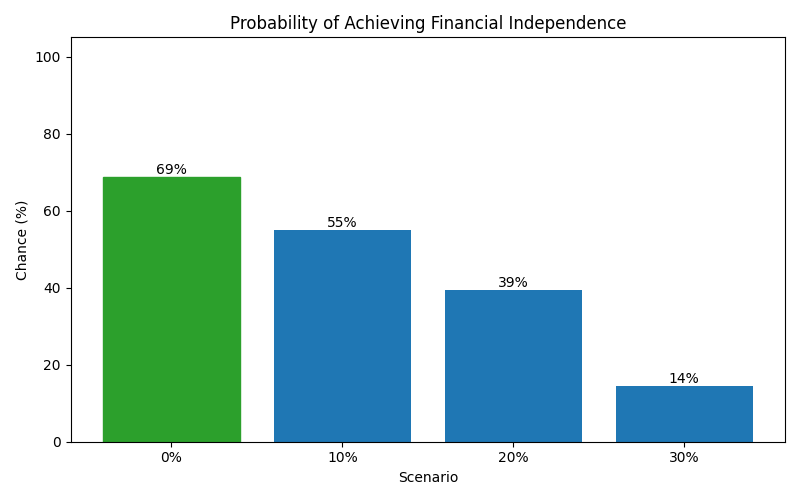
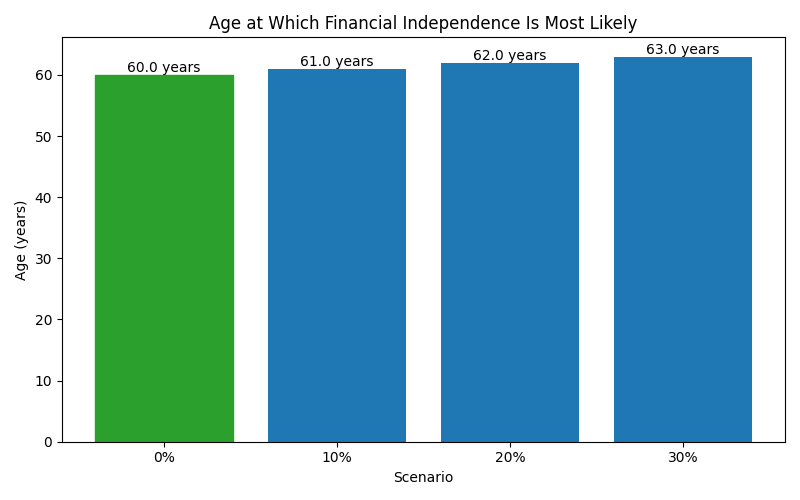
| 0% | 404,398 | 260,021 | 628,584 | 69% | 60 |
| 10% | 356,935 | 230,271 | 561,956 | 55% | 61 |
| 20% | 309,347 | 200,436 | 487,018 | 39% | 62 |
| 30% | 241,174 | 159,763 | 376,262 | 14% | 63 |
These charts show how each scenario affects long-term outcomes, including expected wealth, downside risk, and the likelihood of achieving financial independence.