Varied parameter
Income growth (annual)
1% → 5%
Freelancer / Contractor in Barcelona · Fast-track independence
This page compares financial outcomes for a Freelancer / Contractor living in Barcelona, Spain, following the Fast-track independence life scenario.
A high-intensity saving and investing strategy aimed at reaching financial independence as early as possible. Strong outcomes require discipline, sacrifice, and tolerance for market risk.
Barcelona combines a broad service and tech market with elevated living costs relative to the Spanish national average.
The comparison focuses on how changing the Income growth (annual) influences long-term results, while all other assumptions remain constant.
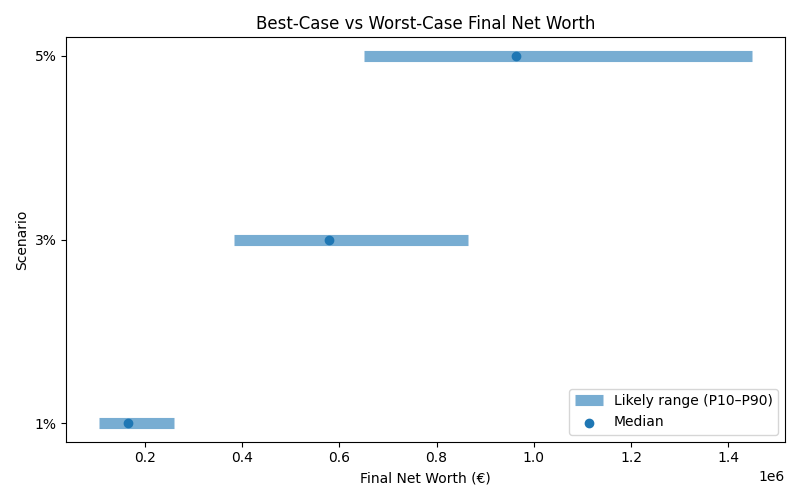
Results are shown as a realistic range. P10 represents a pessimistic outcome, while P90 represents an optimistic outcome. Most simulations fall between these two values.
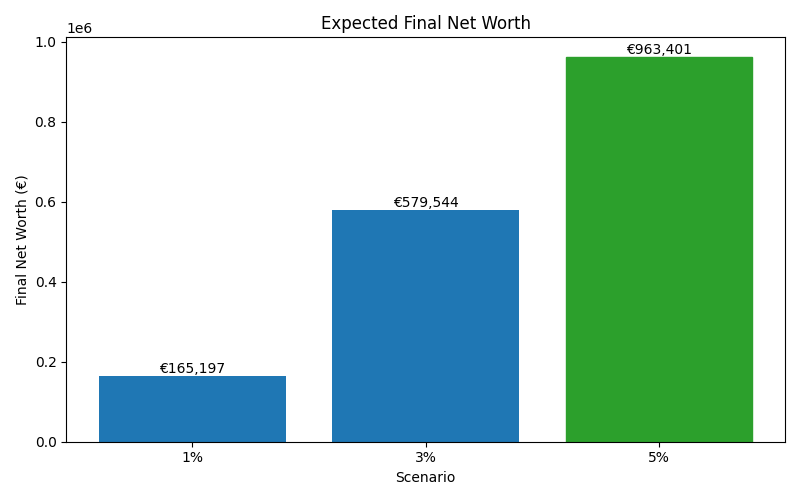
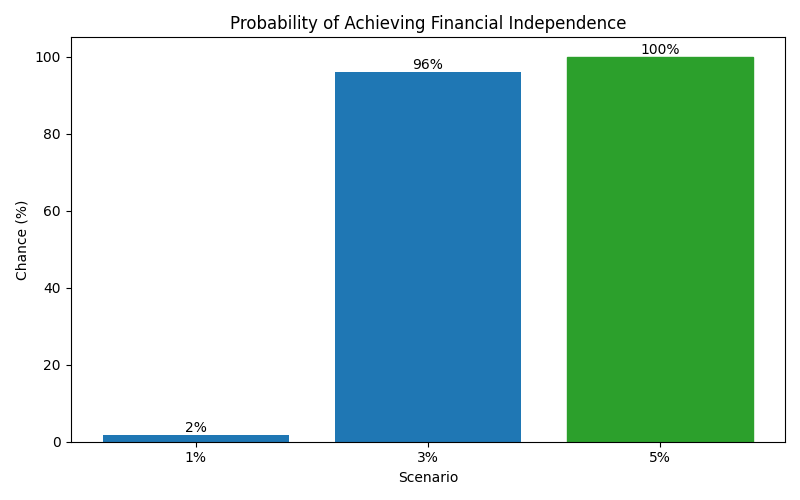
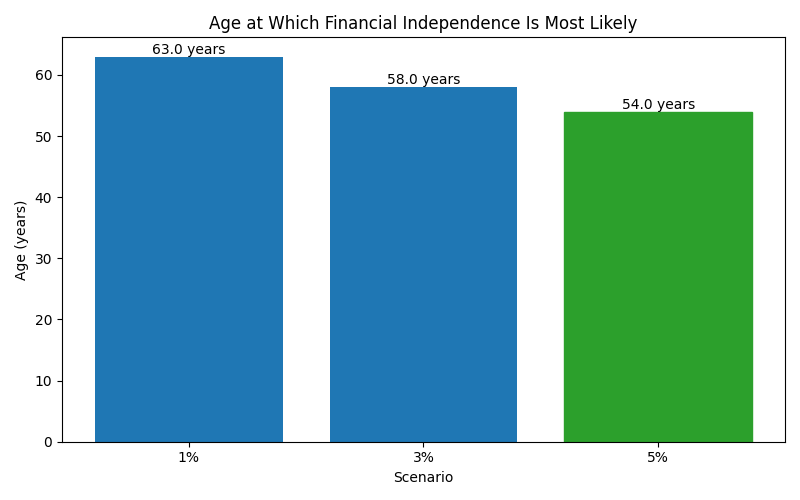
| Scenario | Median Net Worth | P10 Net Worth | P90 Net Worth | FI Probability | FI Median Age |
|---|---|---|---|---|---|
| 1% | 165,197 | 105,479 | 258,882 | 2% | 63 |
| 3% | 579,544 | 382,959 | 864,101 | 96% | 58 |
| 5% | 963,401 | 650,519 | 1,449,403 | 100% | 54 |
These charts show how each scenario affects long-term outcomes, including expected wealth, downside risk, and the likelihood of achieving financial independence.