Varied parameter
Income growth (annual)
1% → 5%
Freelancer / Contractor in Cluj-Napoca · A volatile financial ride
This page compares financial outcomes for a Freelancer / Contractor living in Cluj-Napoca, Romania, following the A volatile financial ride life scenario.
A highly unstable financial path combining income uncertainty, market swings, and repeated adverse events. Outcomes range widely, from recovery and growth to prolonged stagnation.
Cluj-Napoca combines strong tech opportunities with a high quality of life.
The comparison focuses on how changing the Income growth (annual) influences long-term results, while all other assumptions remain constant.
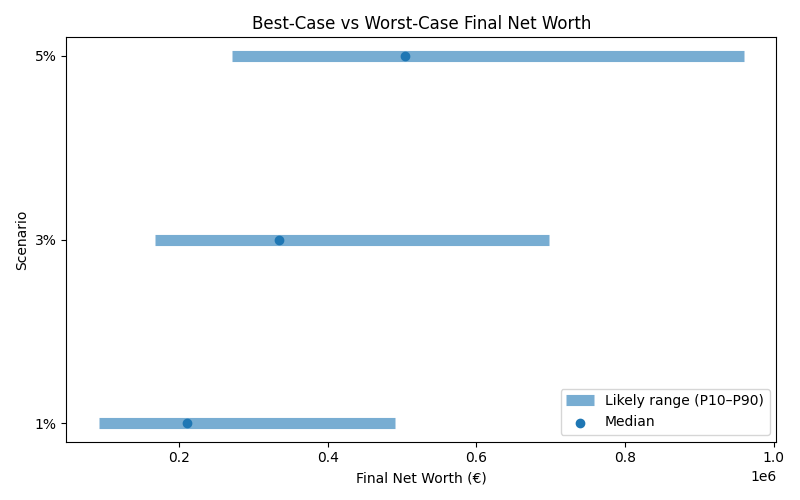
Results are shown as a realistic range. P10 represents a pessimistic outcome, while P90 represents an optimistic outcome. Most simulations fall between these two values.
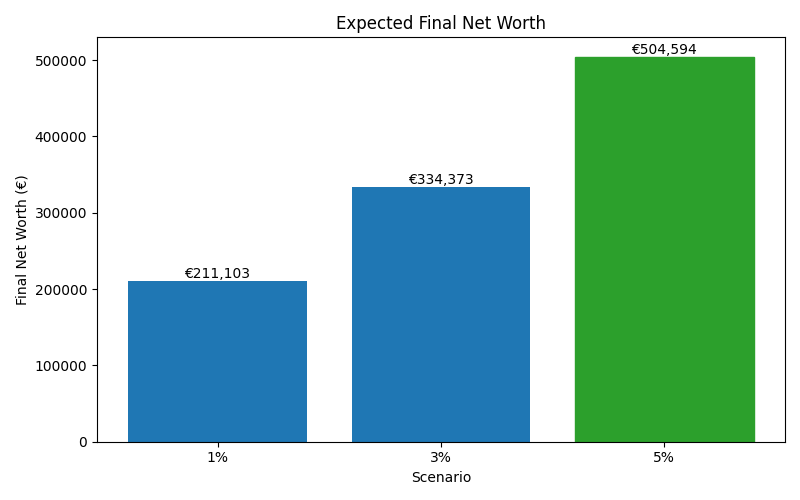
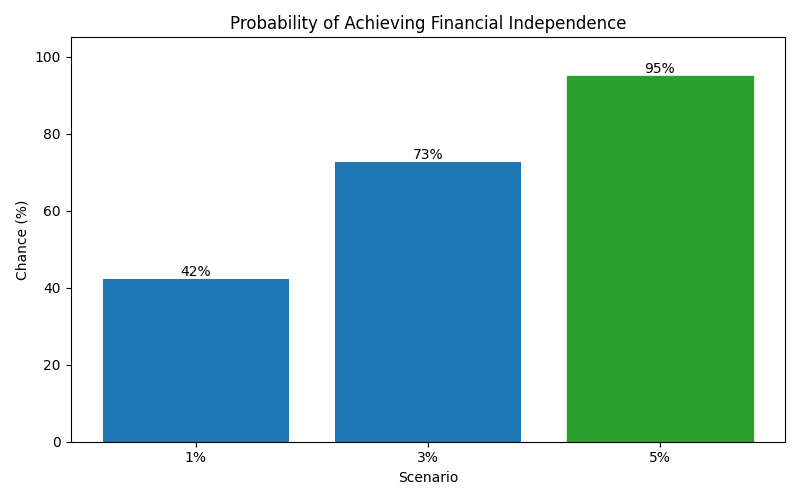
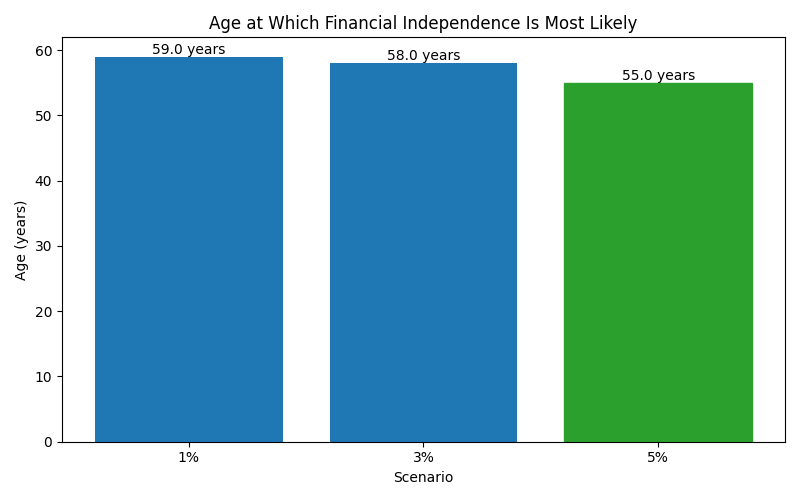
| Scenario | Median Net Worth | P10 Net Worth | P90 Net Worth | FI Probability | FI Median Age |
|---|---|---|---|---|---|
| 1% | 211,103 | 91,549 | 490,300 | 42% | 59 |
| 3% | 334,373 | 167,015 | 697,439 | 73% | 58 |
| 5% | 504,594 | 271,518 | 960,375 | 95% | 55 |
These charts show how each scenario affects long-term outcomes, including expected wealth, downside risk, and the likelihood of achieving financial independence.