Varied parameter
Saving rate
5% → 25%
Freelancer / Contractor in Cluj-Napoca · Peak earning years
This page compares financial outcomes for a Freelancer / Contractor living in Cluj-Napoca, Romania, following the Peak earning years life scenario.
A high-income trajectory with strong saving capacity and rapid wealth accumulation. Compounding works faster here, but results remain exposed to market cycles and timing.
Cluj-Napoca combines strong tech opportunities with a high quality of life.
The comparison focuses on how changing the Saving rate influences long-term results, while all other assumptions remain constant.
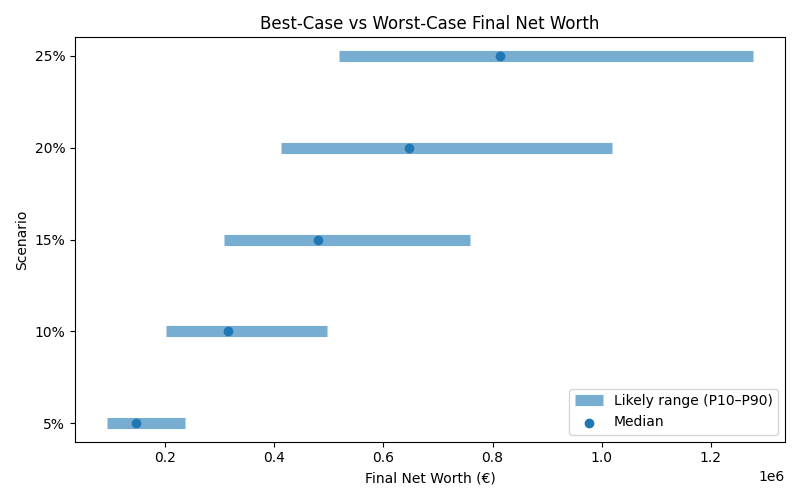
Results are shown as a realistic range. P10 represents a pessimistic outcome, while P90 represents an optimistic outcome. Most simulations fall between these two values.
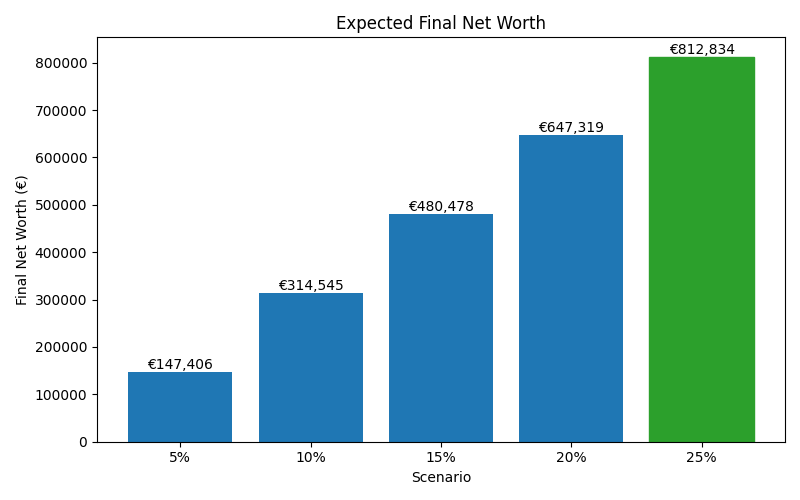
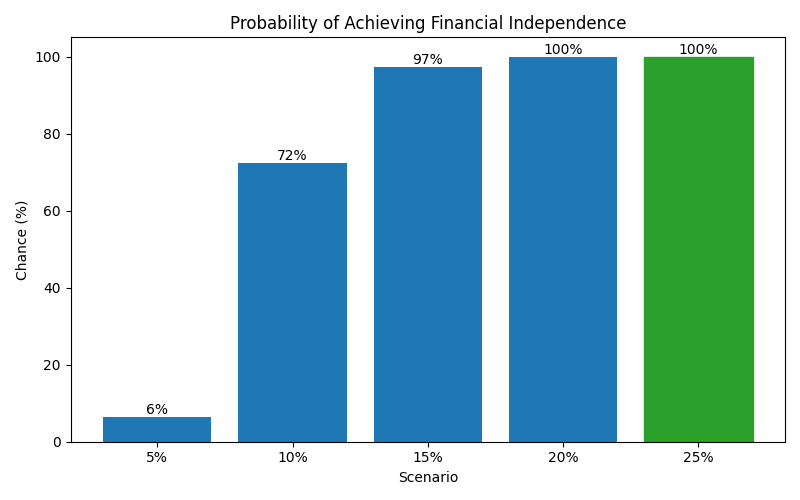
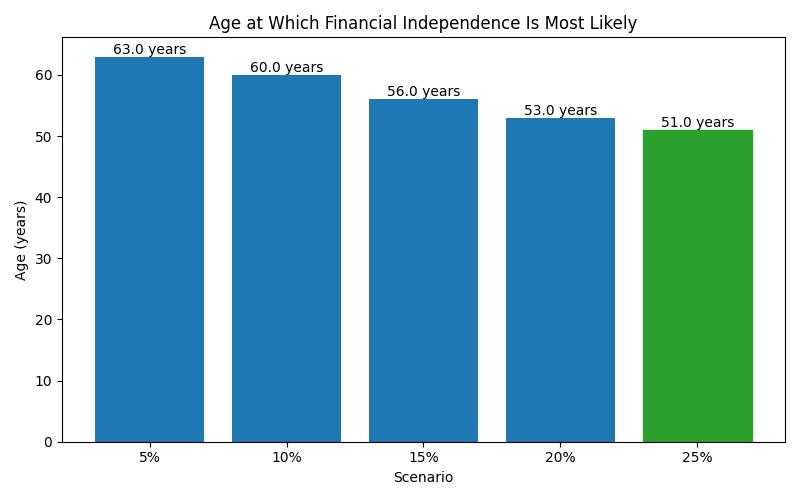
| Scenario | Median Net Worth | P10 Net Worth | P90 Net Worth | FI Probability | FI Median Age |
|---|---|---|---|---|---|
| 5% | 147,406 | 94,138 | 237,287 | 6% | 63 |
| 10% | 314,545 | 201,374 | 497,564 | 72% | 60 |
| 15% | 480,478 | 307,478 | 758,272 | 97% | 56 |
| 20% | 647,319 | 412,084 | 1,018,017 | 100% | 53 |
| 25% | 812,834 | 518,627 | 1,276,745 | 100% | 51 |
These charts show how each scenario affects long-term outcomes, including expected wealth, downside risk, and the likelihood of achieving financial independence.