Varied parameter
Investment return (expected)
3% → 7%
Freelancer / Contractor in Cluj-Napoca · Fast-track independence
This page compares financial outcomes for a Freelancer / Contractor living in Cluj-Napoca, Romania, following the Fast-track independence life scenario.
A high-intensity saving and investing strategy aimed at reaching financial independence as early as possible. Strong outcomes require discipline, sacrifice, and tolerance for market risk.
Cluj-Napoca combines strong tech opportunities with a high quality of life.
The comparison focuses on how changing the Investment return (expected) influences long-term results, while all other assumptions remain constant.
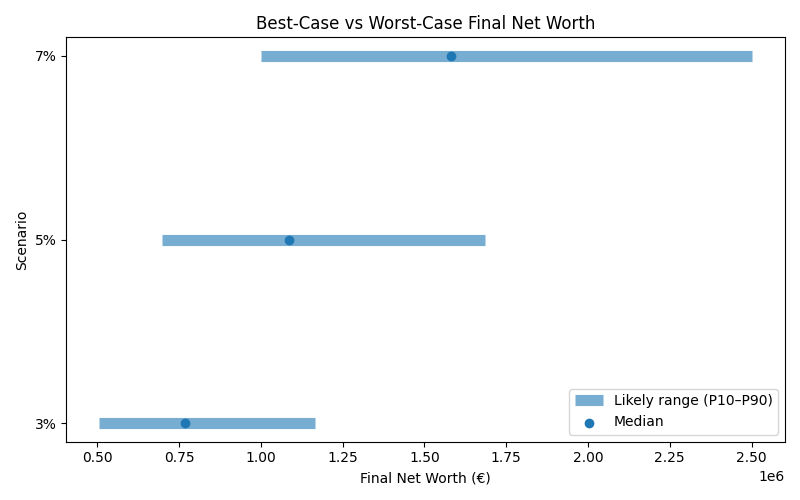
Results are shown as a realistic range. P10 represents a pessimistic outcome, while P90 represents an optimistic outcome. Most simulations fall between these two values.
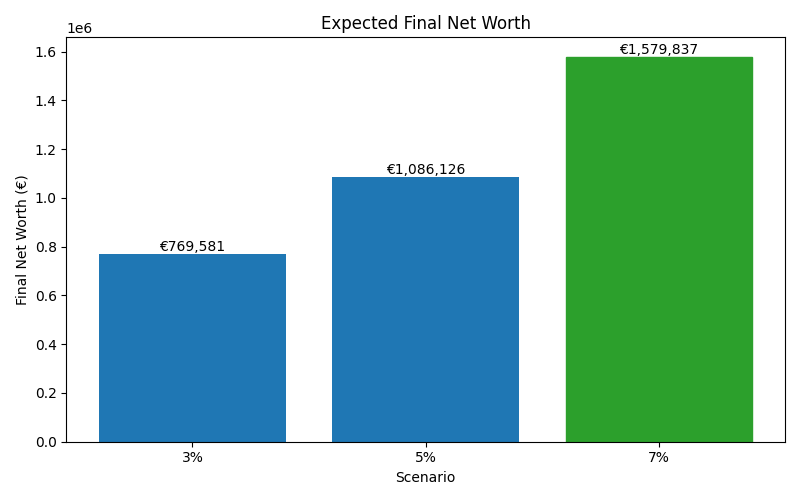
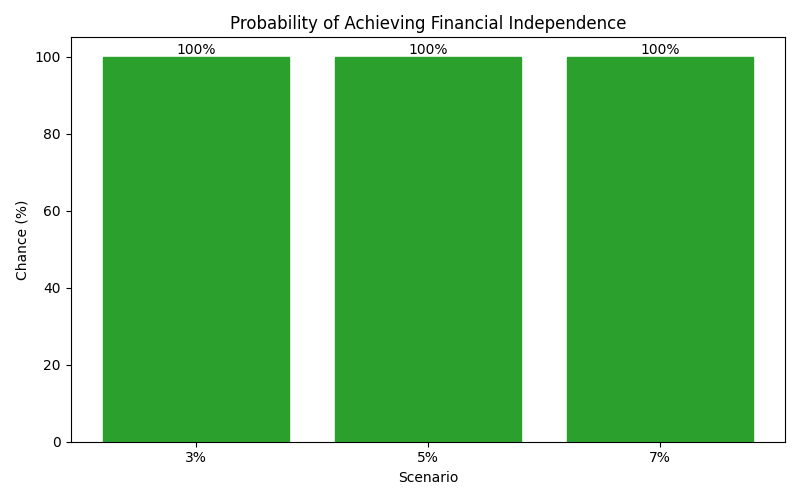
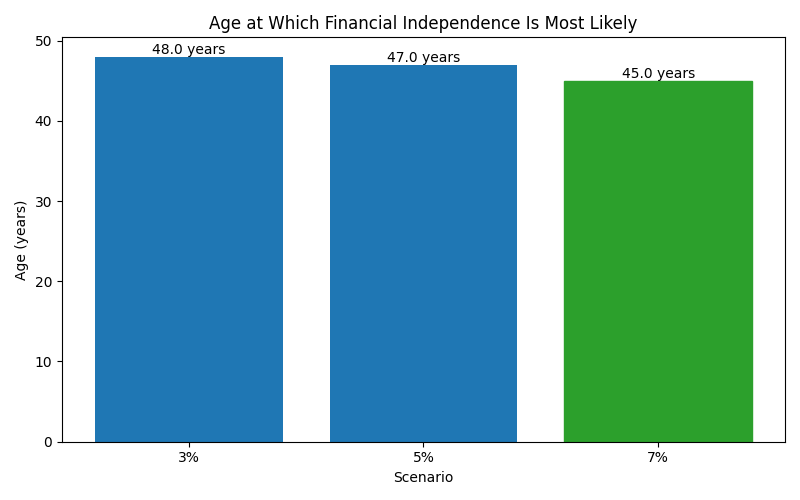
| Scenario | Median Net Worth | P10 Net Worth | P90 Net Worth | FI Probability | FI Median Age |
|---|---|---|---|---|---|
| 3% | 769,581 | 504,690 | 1,165,101 | 100% | 48 |
| 5% | 1,086,126 | 698,181 | 1,684,894 | 100% | 47 |
| 7% | 1,579,837 | 1,001,176 | 2,502,424 | 100% | 45 |
These charts show how each scenario affects long-term outcomes, including expected wealth, downside risk, and the likelihood of achieving financial independence.