Varied parameter
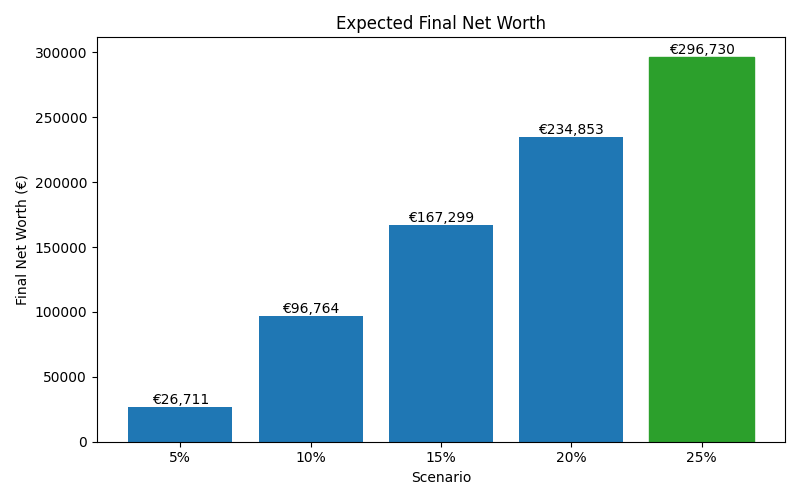
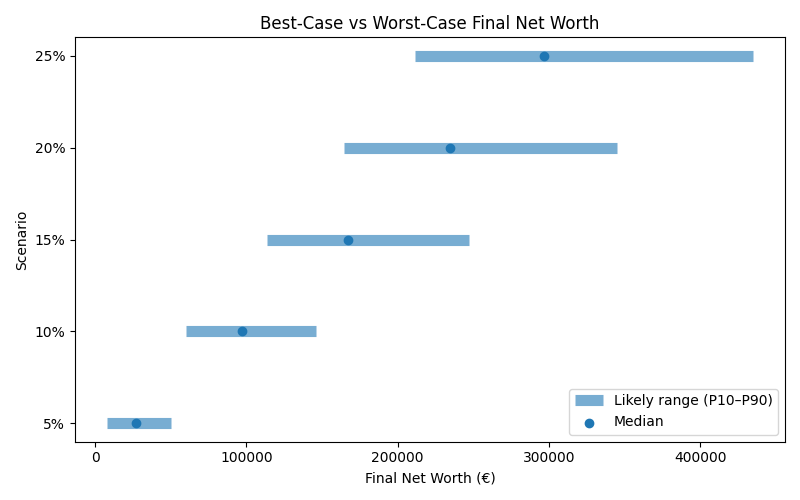
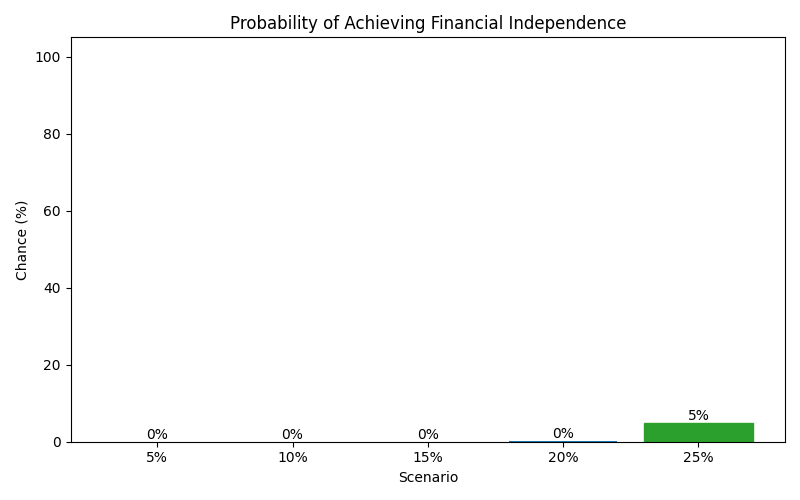
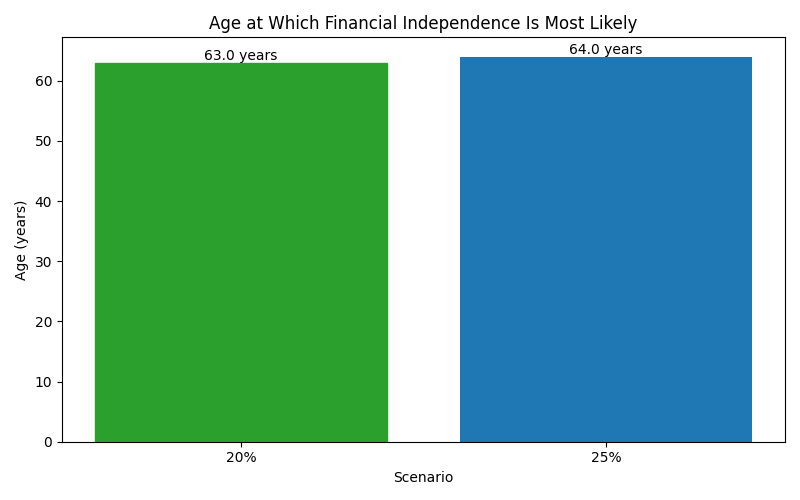
Saving rate
5% → 25%
Freelancer / Contractor in Munich · Independent and uneven
This page compares financial outcomes for a Freelancer / Contractor living in Munich, Germany, following the Independent and uneven life scenario.
A non-linear income path shaped by project-based work, variability, and self-managed risk. Flexibility is high, but consistency must be actively created rather than assumed.
Munich offers very strong income potential in high-skill sectors, along with some of the highest living costs in Germany.
The comparison focuses on how changing the Saving rate influences long-term results, while all other assumptions remain constant.
Results are shown as a realistic range. P10 represents a pessimistic outcome, while P90 represents an optimistic outcome. Most simulations fall between these two values.
| Scenario | Median Net Worth | P10 Net Worth | P90 Net Worth | FI Probability | FI Median Age |
|---|---|---|---|---|---|
| 5% | 26,711 | 8,043 | 49,893 | 0% | — |
| 10% | 96,764 | 59,909 | 145,757 | 0% | — |
| 15% | 167,299 | 113,879 | 247,464 | 0% | — |
| 20% | 234,853 | 164,638 | 344,684 | 0% | 63 |
| 25% | 296,730 | 211,710 | 434,709 | 5% | 64 |
These charts show how each scenario affects long-term outcomes, including expected wealth, downside risk, and the likelihood of achieving financial independence.