Varied parameter
Investment return (expected)
3% → 7%
Freelancer / Contractor in Berlin · A volatile financial ride
This page compares financial outcomes for a Freelancer / Contractor living in Berlin, Germany, following the A volatile financial ride life scenario.
A highly unstable financial path combining income uncertainty, market swings, and repeated adverse events. Outcomes range widely, from recovery and growth to prolonged stagnation.
Berlin has a diverse economy with strong demand in technology and services, paired with a relatively high cost of living.
The comparison focuses on how changing the Investment return (expected) influences long-term results, while all other assumptions remain constant.
Results are shown as a realistic range. P10 represents a pessimistic outcome, while P90 represents an optimistic outcome. Most simulations fall between these two values.
| Scenario | Median Net Worth | P10 Net Worth | P90 Net Worth | FI Probability | FI Median Age |
|---|---|---|---|---|---|
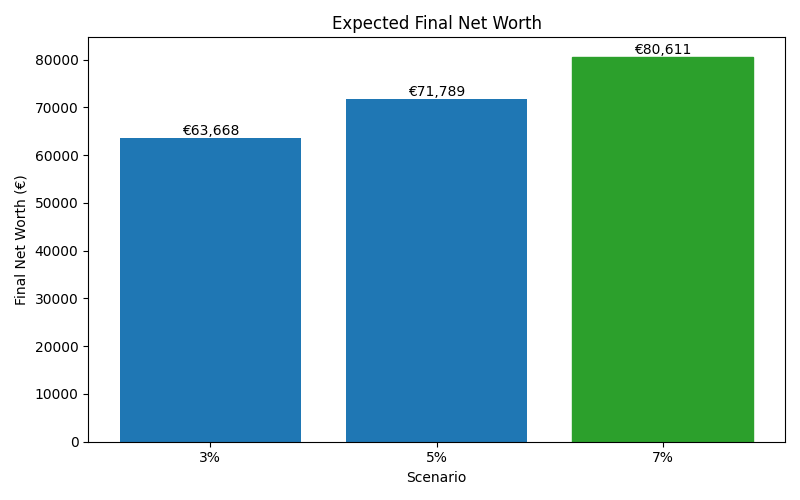
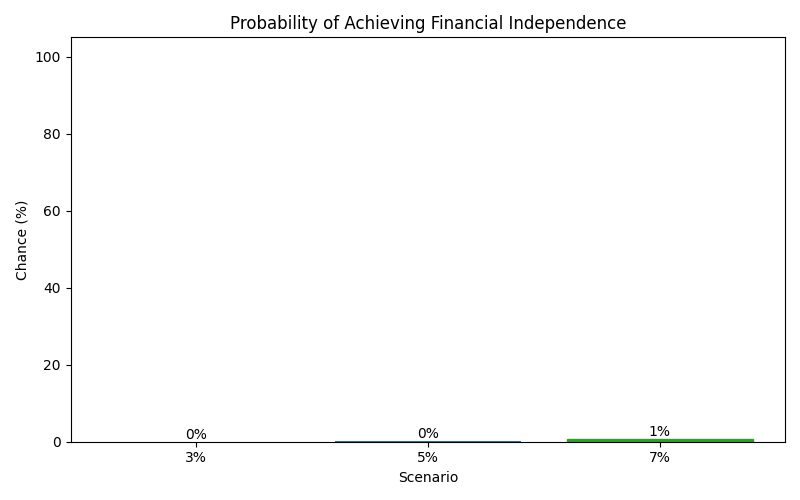
| 3% | 63,668 | 6,713 | 142,042 | 0% | — |
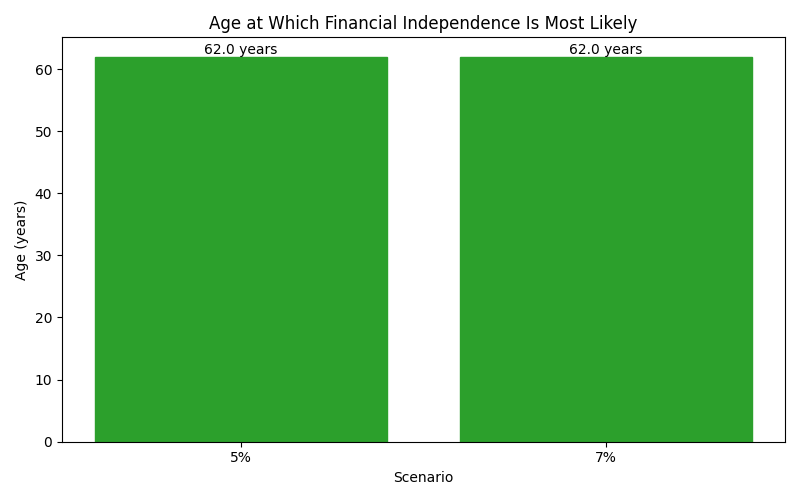
| 5% | 71,789 | 6,936 | 170,613 | 0% | 62 |
| 7% | 80,611 | 7,164 | 204,279 | 1% | 62 |
These charts show how each scenario affects long-term outcomes, including expected wealth, downside risk, and the likelihood of achieving financial independence.