Varied parameter
Income tax rate
0% → 30%
Freelancer / Contractor in Berlin · A volatile financial ride
This page compares financial outcomes for a Freelancer / Contractor living in Berlin, Germany, following the A volatile financial ride life scenario.
A highly unstable financial path combining income uncertainty, market swings, and repeated adverse events. Outcomes range widely, from recovery and growth to prolonged stagnation.
Berlin has a diverse economy with strong demand in technology and services, paired with a relatively high cost of living.
The comparison focuses on how changing the Income tax rate influences long-term results, while all other assumptions remain constant.
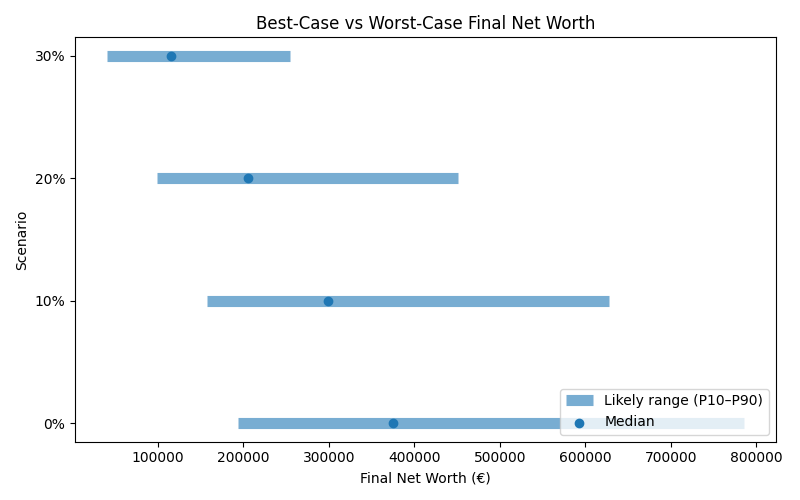
Results are shown as a realistic range. P10 represents a pessimistic outcome, while P90 represents an optimistic outcome. Most simulations fall between these two values.
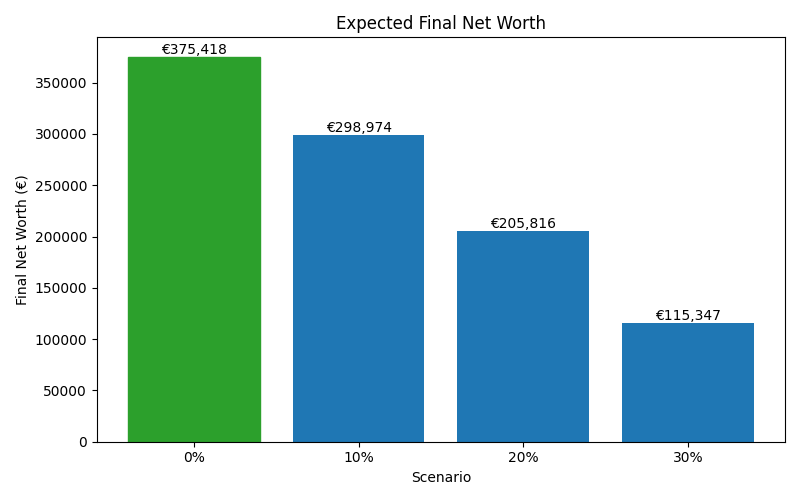
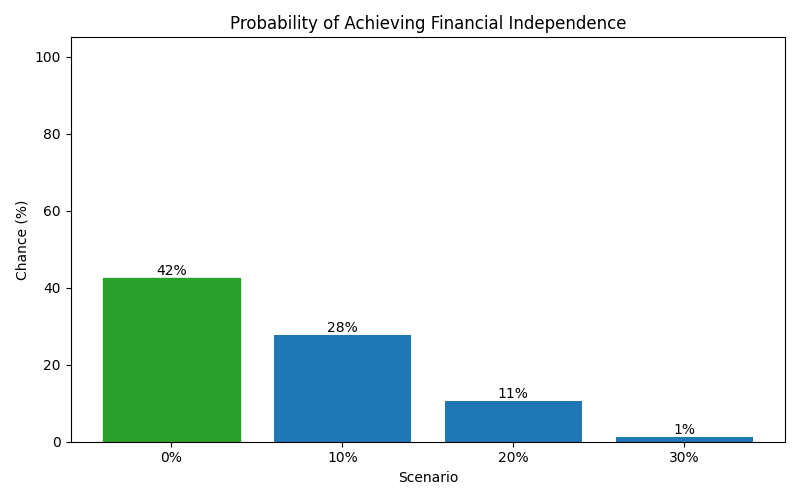
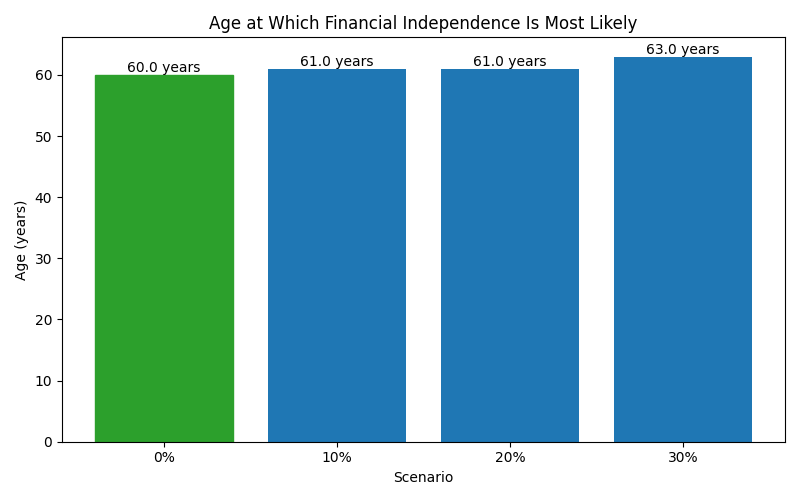
| Scenario | Median Net Worth | P10 Net Worth | P90 Net Worth | FI Probability | FI Median Age |
|---|---|---|---|---|---|
| 0% | 375,418 | 193,843 | 785,401 | 42% | 60 |
| 10% | 298,974 | 157,941 | 627,326 | 28% | 61 |
| 20% | 205,816 | 99,390 | 450,484 | 11% | 61 |
| 30% | 115,347 | 40,483 | 255,069 | 1% | 63 |
These charts show how each scenario affects long-term outcomes, including expected wealth, downside risk, and the likelihood of achieving financial independence.