Varied parameter
Investment return (expected)
3% → 7%
Freelancer / Contractor in Berlin · Independent and uneven
This page compares financial outcomes for a Freelancer / Contractor living in Berlin, Germany, following the Independent and uneven life scenario.
A non-linear income path shaped by project-based work, variability, and self-managed risk. Flexibility is high, but consistency must be actively created rather than assumed.
Berlin has a diverse economy with strong demand in technology and services, paired with a relatively high cost of living.
The comparison focuses on how changing the Investment return (expected) influences long-term results, while all other assumptions remain constant.
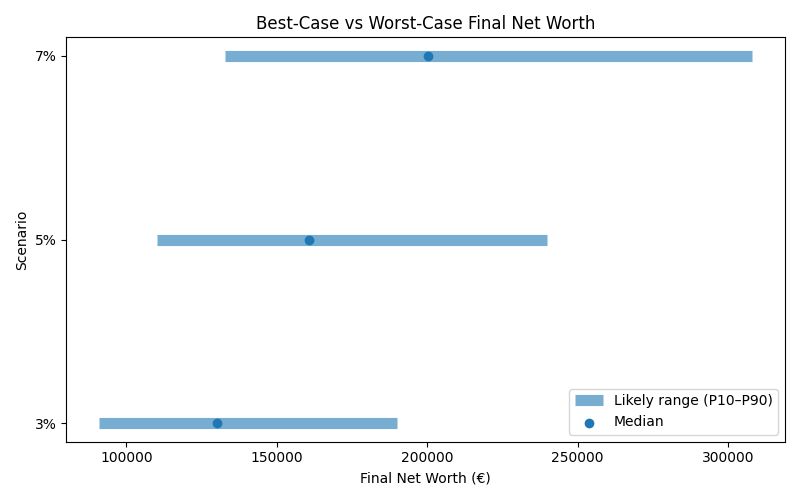
Results are shown as a realistic range. P10 represents a pessimistic outcome, while P90 represents an optimistic outcome. Most simulations fall between these two values.
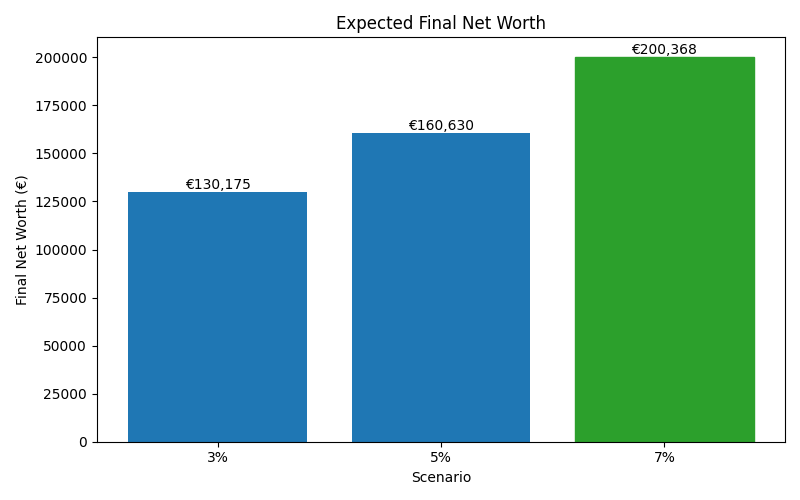
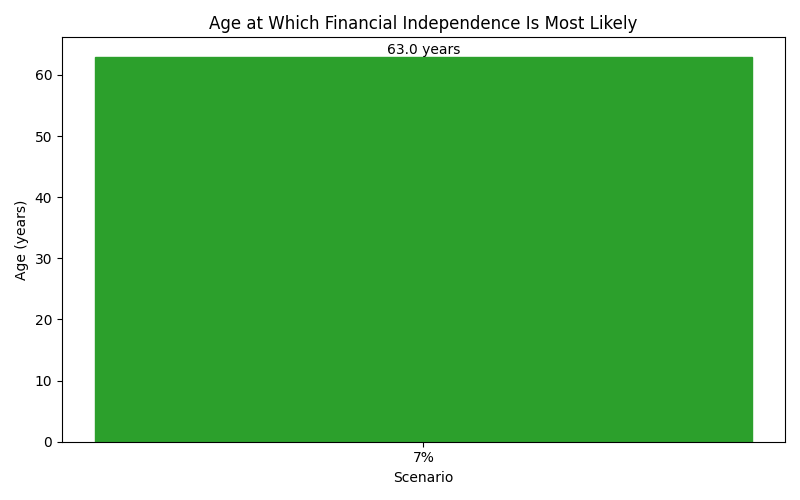
| Scenario | Median Net Worth | P10 Net Worth | P90 Net Worth | FI Probability | FI Median Age |
|---|---|---|---|---|---|
| 3% | 130,175 | 90,864 | 190,092 | 0% | — |
| 5% | 160,630 | 110,034 | 239,870 | 0% | — |
| 7% | 200,368 | 132,944 | 308,062 | 0% | 63 |
These charts show how each scenario affects long-term outcomes, including expected wealth, downside risk, and the likelihood of achieving financial independence.