Varied parameter
Income tax rate
0% → 30%
Freelancer / Contractor in Berlin · Independent and uneven
This page compares financial outcomes for a Freelancer / Contractor living in Berlin, Germany, following the Independent and uneven life scenario.
A non-linear income path shaped by project-based work, variability, and self-managed risk. Flexibility is high, but consistency must be actively created rather than assumed.
Berlin has a diverse economy with strong demand in technology and services, paired with a relatively high cost of living.
The comparison focuses on how changing the Income tax rate influences long-term results, while all other assumptions remain constant.
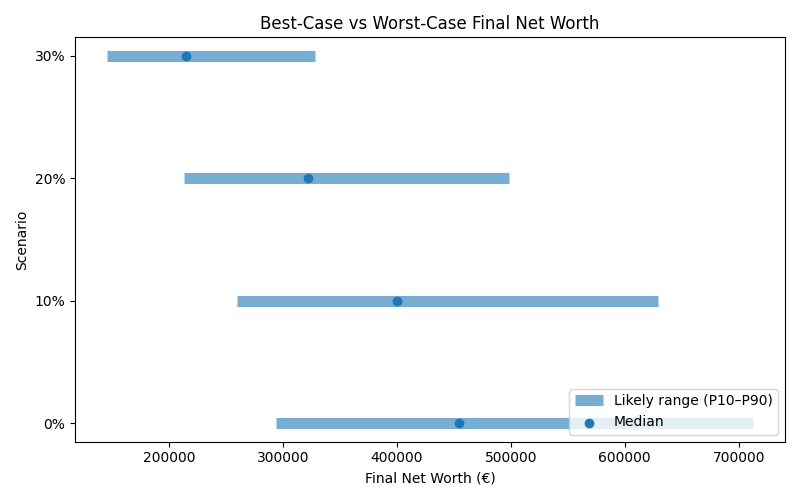
Results are shown as a realistic range. P10 represents a pessimistic outcome, while P90 represents an optimistic outcome. Most simulations fall between these two values.
| Scenario | Median Net Worth | P10 Net Worth | P90 Net Worth | FI Probability | FI Median Age |
|---|---|---|---|---|---|
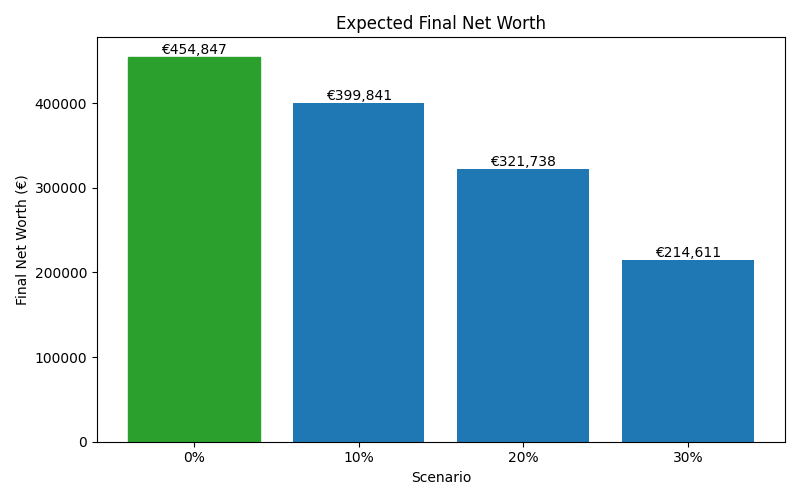
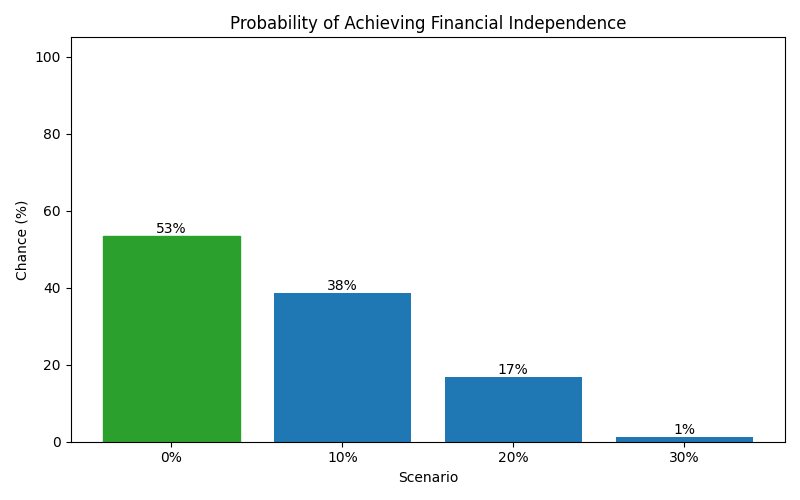
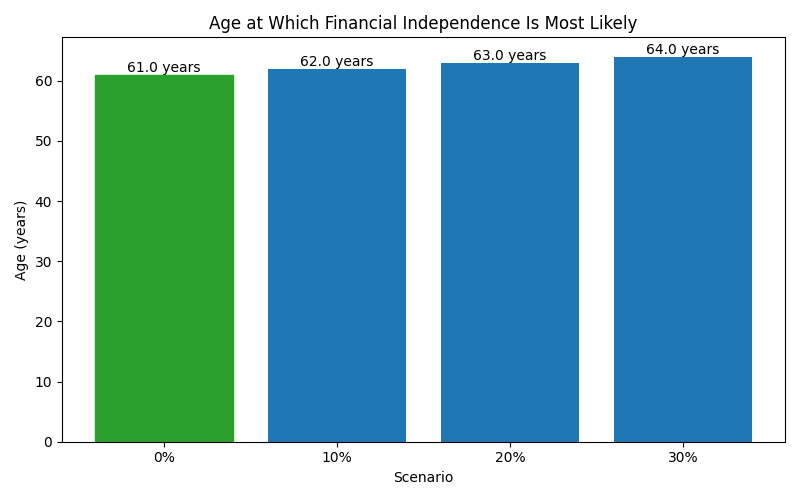
| 0% | 454,847 | 293,727 | 712,358 | 53% | 61 |
| 10% | 399,841 | 259,453 | 628,927 | 38% | 62 |
| 20% | 321,738 | 212,969 | 498,208 | 17% | 63 |
| 30% | 214,611 | 145,909 | 328,292 | 1% | 64 |
These charts show how each scenario affects long-term outcomes, including expected wealth, downside risk, and the likelihood of achieving financial independence.